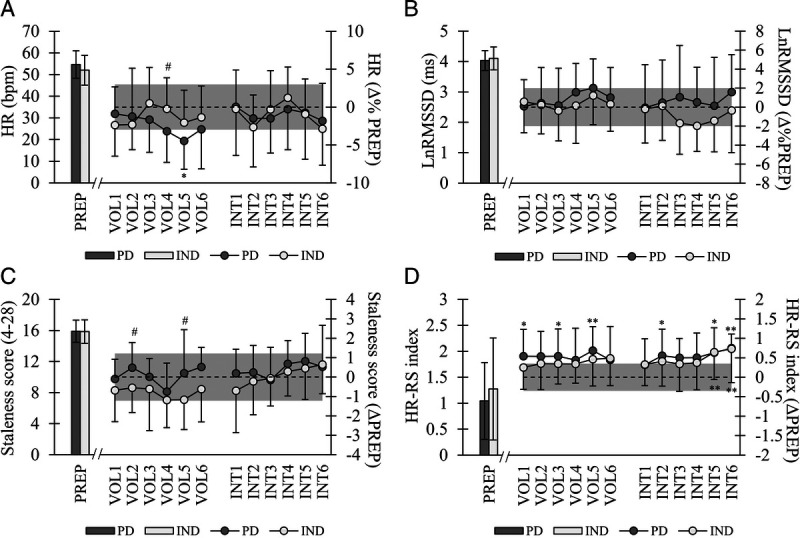
FIGURE 5.

Mean ± SD baseline values (PREP) and weekly changes (VOL1–6, INT1–6) in nocturnal HR (A), nocturnal LnRMSSD (B), staleness score (C), and HR–RS index (D). Gray area represents the SWC of the parameter based on individual average values during PREP. In A and B = 0.5 × CV, in C and D = 0.5 × SD. *P < 0.05, **P < 0.01, ***P < 0.001 within groups compared with PREP. #P < 0.05 between groups at respective time point.
