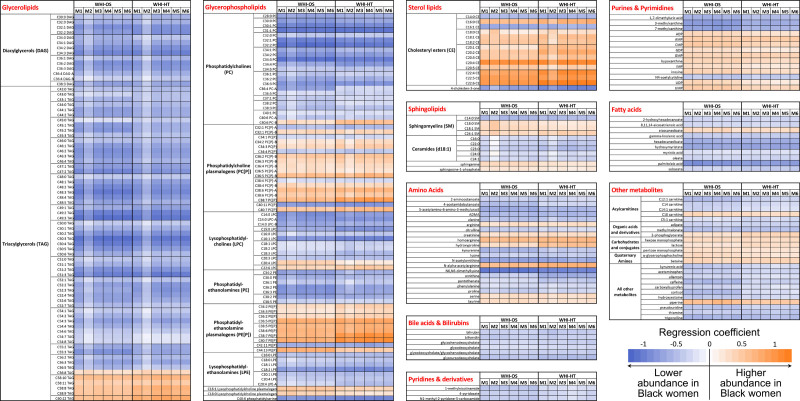
Figure 2.
Differences in metabolite levels between Black and White women in the Women’s Health Initiative (WHI). The heatmap shows regression coefficients for each metabolite in each category. Model 1 (M1; fully adjusted) is adjusted for coronary heart disease (CHD) case-control status, matching factors (age, hysterectomy, and enrollment window), hormone therapy use status, body mass index, smoking status, alcohol consumption, education, family income, physical activity, baseline health conditions (diabetes, hypertension, and depression), and medication use (aspirin, lipid-lowing, antihyperglycemic, antihypertensive, and antidepressants). Model 2 (M2; lipid-adjusted): M1 plus total and high-density lipoprotein cholesterol. Model 3 (M3; diet quality-adjusted): M1 plus Healthy Eating Index-2005. Model 4 (M4; macronutrient-adjusted): M1 plus dietary intake of proteins, total carbohydrates, and total fat. Model 5 (M5; calorie-adjusted): M1 plus total calorie intake. Model 6 (psychological factors-adjusted): M1 plus psychological indicators (emotional well-being, hostility, general health, optimism, social support, social functioning, social strain, and sleep disturbance). WHI-HT indicates WHI-Hormone Therapy; and WHI-OS, WHI-Observational Study.

