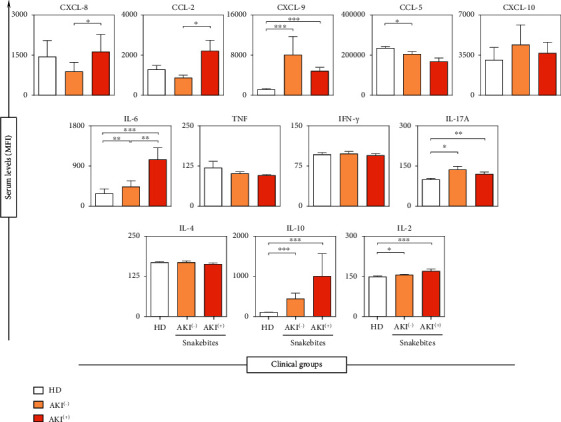
Figure 2.

Concentration of soluble immunological molecules on admission of the patient (T0), in the groups AKI(+), AKI(-), and HD. ∗p < 0.01; ∗∗p < 0.008; ∗∗∗p < 0.0001. The results are expressed as the mean ± standard deviation in MFI (mean fluorescent intensity), and the statistical analysis was performed using the Kruskal-Wallis test followed by Dunn's test.
