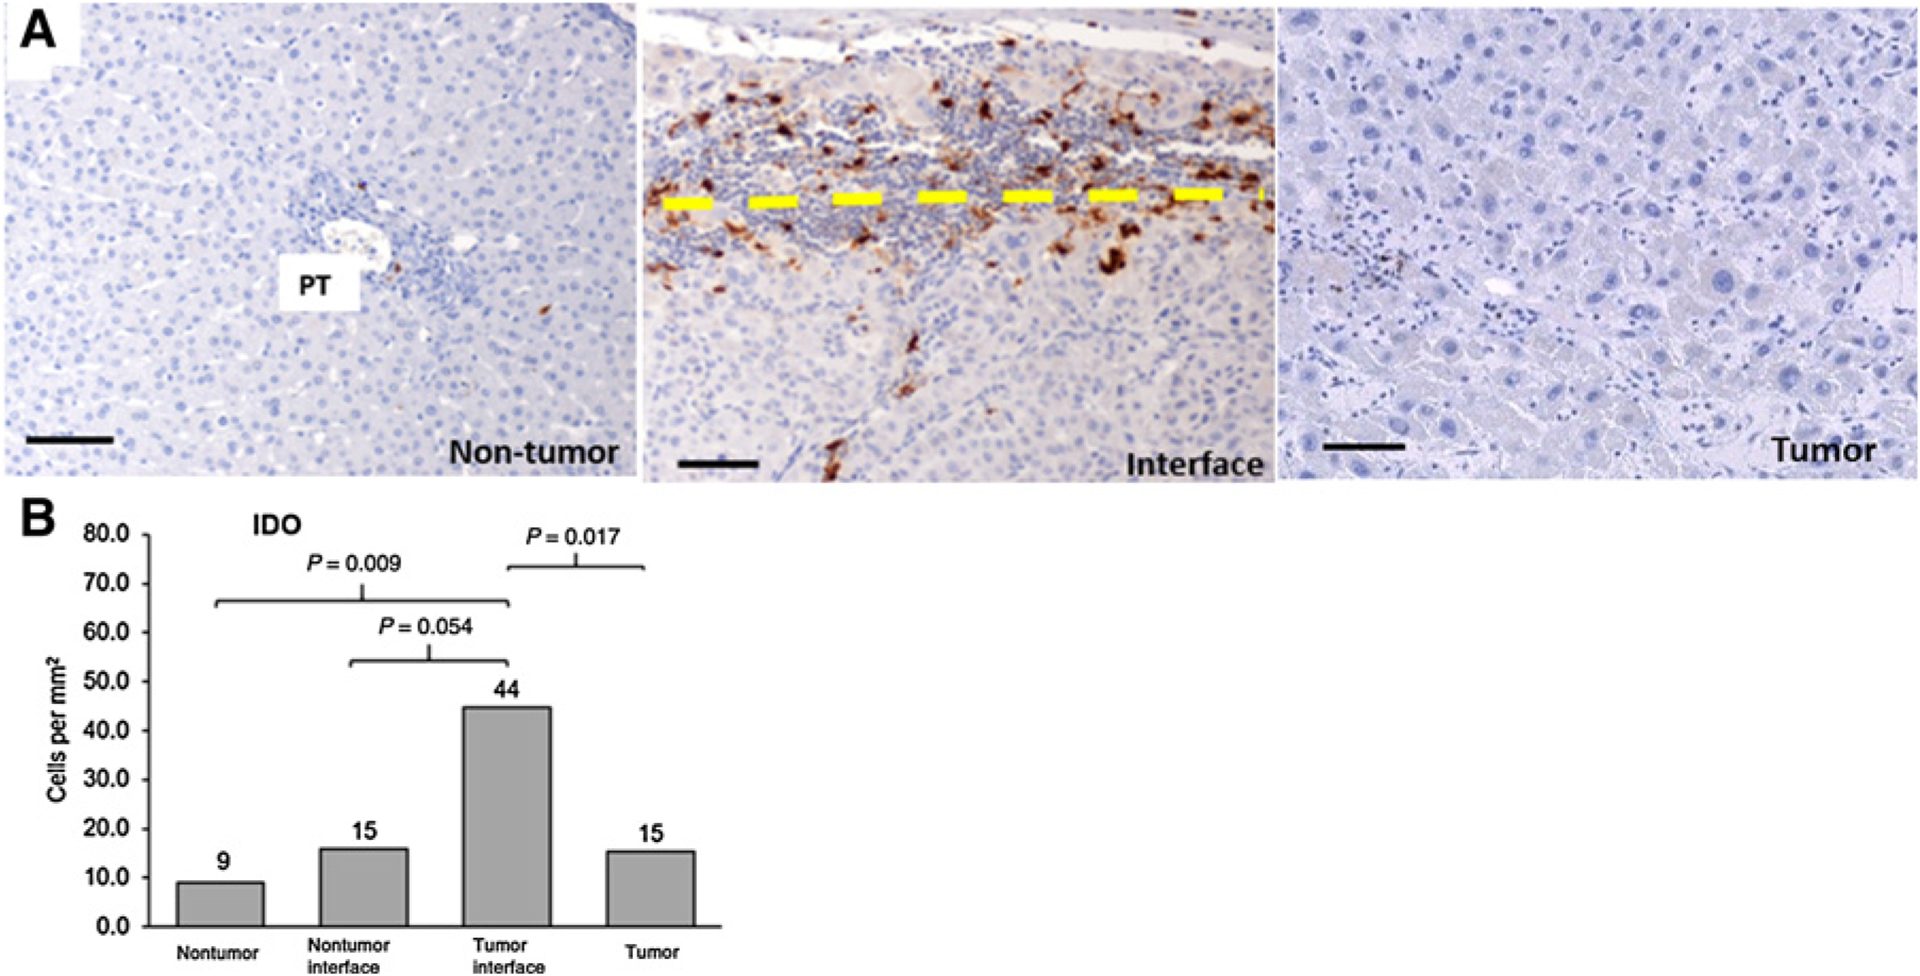
Figure 2.

A, IDO expression in the TME. Representative images of IDO expression in tumor and nontumor zones. The interface was further stratified as tumor-side (above the dashed line) and nontumor side (below the dashed line). Dark brown stains indicate IDO expression. PT, portal tract. B, Median cell densities of each region are shown above each bar. Scale bar, 100 μm. 20 × magnification. Thirty-one tumor regions, 10 tumor and nontumor interface regions, and 15 nontumor regions were analyzed. Quintile regression analysis was used with a P value of ≤ 0.05 to define statistical significance.
