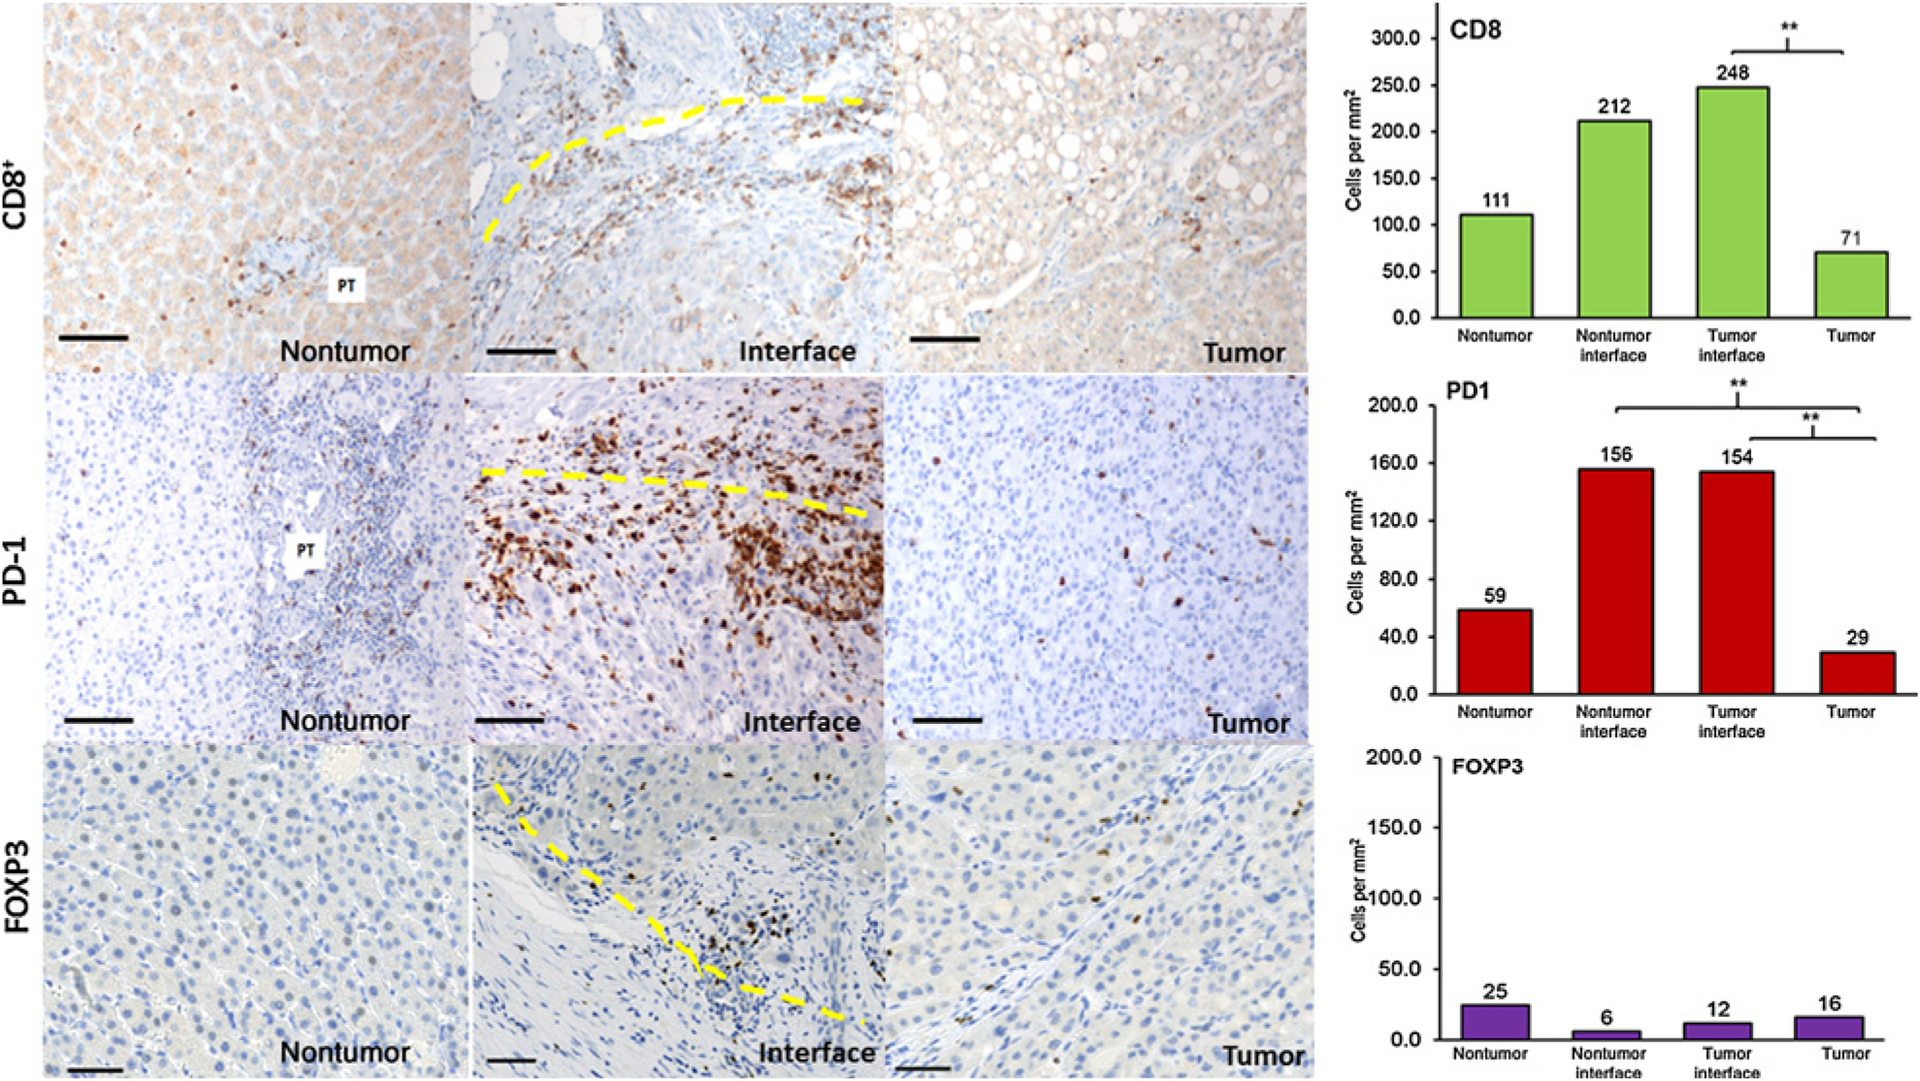
Figure 3.

CD8+, PD-1+, and FOXP3+ expression in the TME. Nontumor regions, peritumoral interface, and tumor regions were stained by CD8+ (top row), PD-1+ (middle row), and FOXP3+ (bottom row) markers. Interface zone: yellow line. Scale bar, 100 μm. 20 × magnification. Graph: median cell densities of each region are shown above each bar graph. Thirty-one tumor regions, 10 tumor and nontumor interface regions, and 15 nontumor regions were analyzed. Quintile regression analysis was used with a P value of ≤ 0.05 to define statistical significance, as noted by **.
