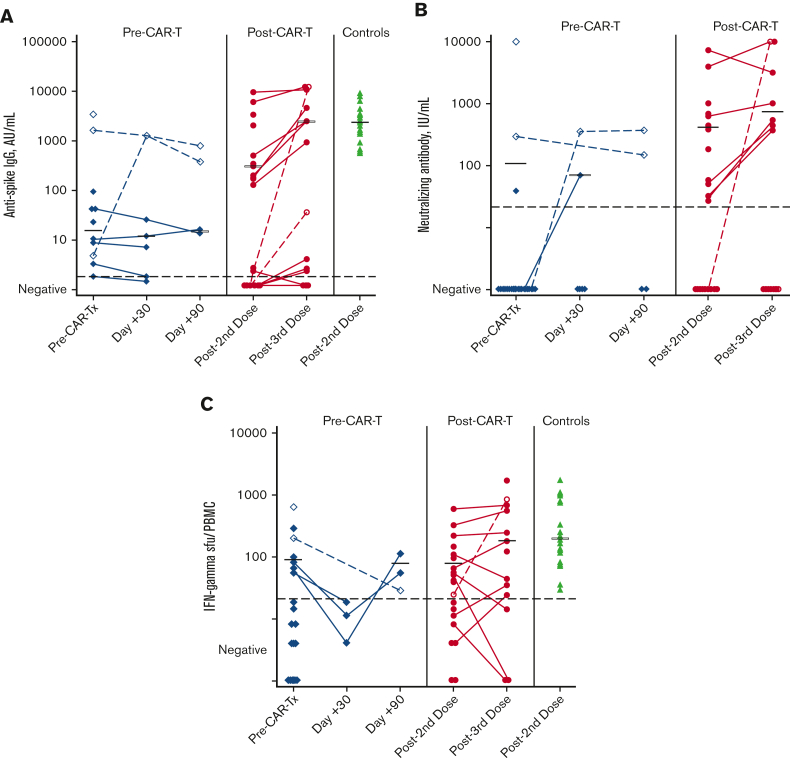
Figure 1.
Humoral and cellular responses by cohort. (A) Anti-S IgG assay results by cohort. (B) Neutralizing antibody assay results by cohort. (C) ELISPOT T-cell assay results by cohort. The blue diamonds represent the pre–CAR-Tx cohort, the orange circles represent the post–CAR-Tx cohort, and the green triangles represent control samples. Black horizontal bars represent median values among those with a positive result. Open symbols and dashed lines represent individuals who developed antinucleocapsid (N) antibodies and were excluded from median titer calculations on detection of anti-N antibodies. In the pre–CAR-Tx cohort, 1 individual had detectable anti-N antibodies before CAR-Tx, 1 at 30 days after CAR-Tx, and 1 at 90 days after CAR-Tx. In the post–CAR-Tx cohort, 2 individuals became anti-N positive after the third vaccine dose. Dashed lines in black represent the positive cutoff values for each test. Results were log10(x + 1) transformed for figures and before analyses.

