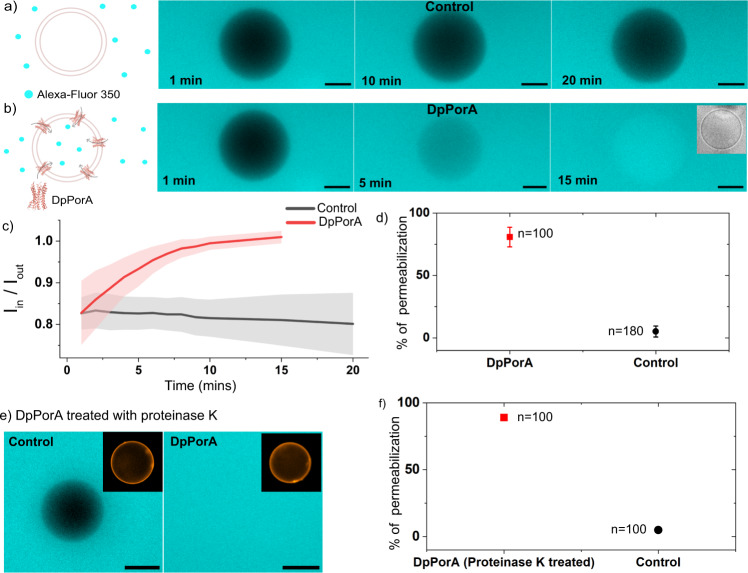
Fig. 4. Functional assembly of DpPorA in giant unilamellar vesicles.
Schematic and representative fluorescence image of single vesicle outlining the transport of molecules in a time-dependent manner in the a absence of a pore and b in the presence of DpPorA, where false blue color represents the Alexa-Fluor 350 dye in vesicles. Inset shows the phase-contrast image of the vesicle. c Time-dependant curve of normalized intensity of single vesicles with DpPorA (n = 24 individual vesicles) and without peptide (n = 10 individual vesicles) is represented over time; red and black lines represent the mean values. The shaded region (error bands) represents the corresponding standard error of the mean. d Vesicle permeabilization percentage is shown in the absence and presence of DpPorA. Permeabilization percentage of DpPorA is 80.9 ± 7.9% (red, mean ± SD from n = 100 vesicles and N=5 independent batches) and control is 3.2 ± 3% (black, mean ± SD from n = 180 vesicles and N = 5 independent batches). e Representative fluorescence image of single vesicle in the absence and presence of DpPorA incubated with proteinase K for 15 min displaying dye transport. The false blue color represents the Alexa-Fluor 350 dye in vesicles. Insets display the labeled vesicles in fluorescence. f Vesicle permeabilization percentage in the presence of DpPorA treated with proteinase K. Permeabilization percentage of DpPorA is 88 ± 1.4% (red, mean ± SD from n = 100 vesicles and N = 2 independent batches). Permeabilization percentage of control is 5 ± 1.4% (black, mean ± SD from n = 100 vesicles and N = 2 independent batches). Buffer conditions: 100 mM KCl, 10 mM HEPES pH 7; scale bar: 10 µm. The schematics are created with BioRender.com.

