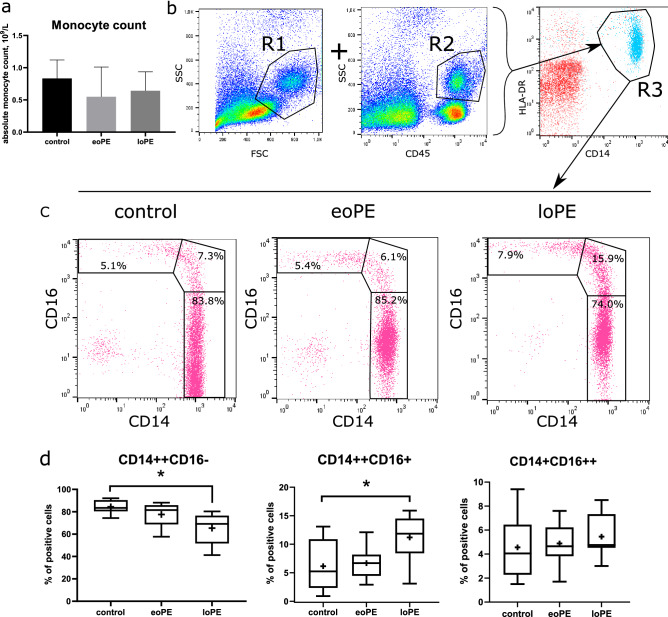
Figure 1.
Characterization of the patient's monocytes. Absolute monocyte counts for three groups of patients according to clinical diagnostic laboratory reports: the data are listed as mean ± SD (a). In flow cytometry analysis, monocytes were defined by sequential gating: cells that were found in both regions of interest R1 on FSC-SSC dot-plot and R2 on SSC-CD45 dot-plot, then were displayed and gated on CD14 versus HLA-DR dot-plot (R3) to exclude B lymphocytes (b). The selected population was analyzed in CD14–CD16 dot-plots. Representative CD14–CD16 dot-plots showing classical (CD14++CD16−), intermediate (CD14++CD16+), and non-classical (CD14+CD16++) monocytes in upper-left, middle and bottom-right regions, respectively (c). Boxplots of classical, intermediate, and non-classical monocyte content for three groups (d): eoPE early-onset PE (n = 12), loPE late-onset PE (n = 10), control (n = 11). *p < 0.05 according to Kruskal–Wallis test with Dunn's post-hoc test; box limits are IQRs, horizontal bars are medians, and crosses are means.

