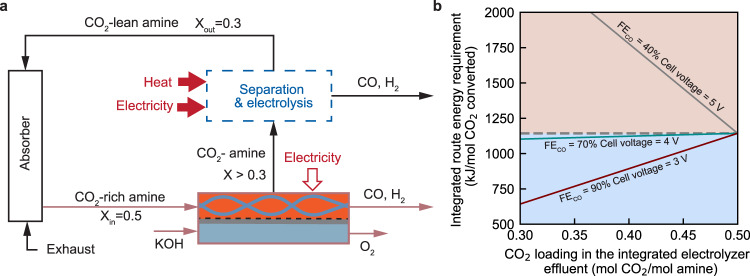
Fig. 4. Effect of the single-pass conversion of the integrated electrolyser on the overall energy efficiency.
a A schematic illustration of the integrated route where the electrolyser is unable to recover the capture media to the lean loading state. The separation and electrolysis process is symbolic process highlighted with a dashed box to regenerate the capture medium to the lean loading state. X represents the CO2 loading in the capture medium, with a unit of mol CO2 per mol amine molecule. b The energy comparison of the integrated route based on baseline (green solid line), pessimistic (grey), and optimistic (red) integrated electrolyser as a function of the electrolyser single-pass conversion. The grey dashed line represents the energy consumption of the sequential route based on state-of-the-art gas-fed CO2 electrolysers. The blue region means that the integrated route is more energy-efficient than the sequential route, while the orange region indicates vice-versa.

