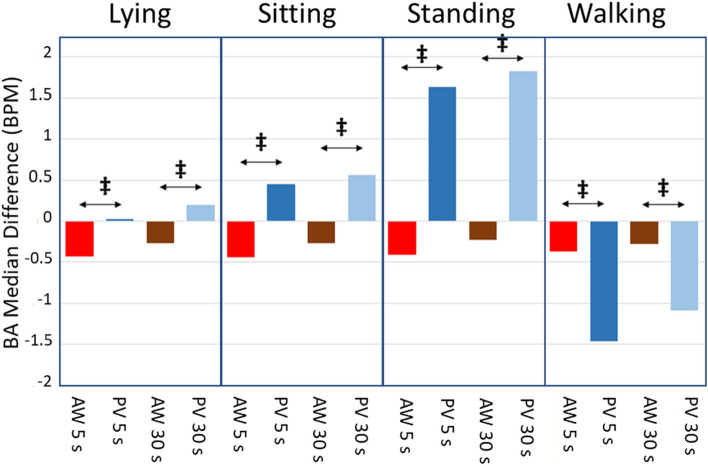
Figure 4.
Median differences of the Bland–Altman for the AW and PV devices for 5 s and 30 s averaging time and for the four activities. Red bars are for AW device and 5 s averaging time, dark blue are for PV device and 5 s, brown are for AW device and 30 s and light blue are for PV device and 30 s. Wilcoxon Rank Sum Test results are also shown comparing the median values of differences for both devices. Significant differences: ‡ p < .001.

