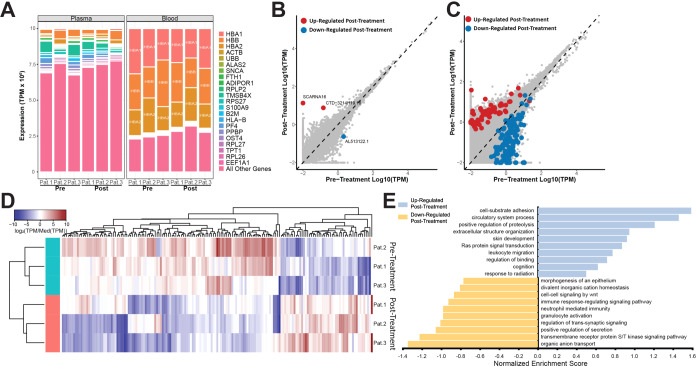
Fig. 2. Differential gene expression analysis in plasma is more informative than in whole blood samples from ICP patients.
A Stacked bar graphs showing the expression (in TPM) of the ten most abundant detected genes in individual plasma and whole blood samples. Pink bars on the bottom represent abundance of all other genes detected. B Scatterplot of all genes detected in pre- and post- treatment whole blood samples. Genes that are significantly up-regulated (p-adj. (Benjamini-Hochberg) < 0.05) in post-treatment samples are shown in red, genes that are significantly down-regulated (p-adj. (Benjamini-Hochberg < 0.05) in post-treatment samples are shown in blue. C Scatterplot of all genes detected in pre- and post- treatment plasma samples. Genes that are significantly up-regulated (p-adj. (Benjamini-Hochberg) < 0.05) in post-treatment samples are shown in red, genes that are significantly down-regulated (p-adj. (Benjamini-Hochberg < 0.05) in post-treatment samples are shown in blue. D Heatmap showing differential expression of significantly differentially expressed genes (p-adj. (Benjamini-Hochberg) < 0.05) between pre-treatment (teal) and post-treatment (salmon) plasma samples of three high-ICP patients. E Gene set enrichment analysis of gene expression in pre- vs. post-treatment high-ICP plasma patient samples (p-adj. (Benjamini-Hochberg) < 0.05).

