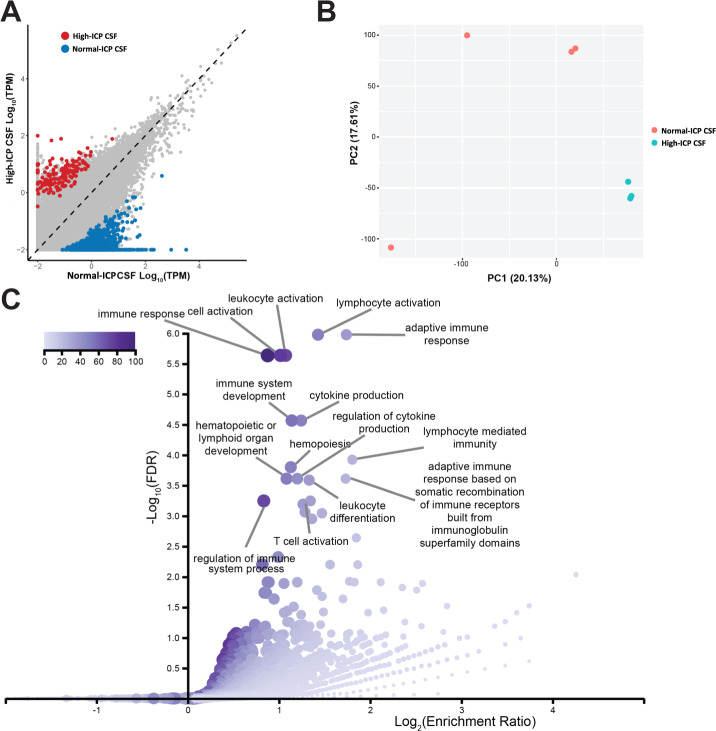
Fig. 3. Patients with high ICP have a different gene expression profile in the CSF extracellular vesicles.
A Scatterplot of all genes detected in high-ICP CSF from patients and normal-ICP CSF samples from a biobank. Genes that are significantly higher (p-adj. (Benjamini-Hochberg) < 0.05) in high-ICP patients are shown in red and genes that are significantly higher in normal-ICP samples (p-adj. (Benjamini-Hochberg) < 0.05) are shown in blue. B PCA of high-ICP (represented in teal) and normal-ICP CSF samples (represented in salmon). C Gene ontology (GO) analysis for genes that are enriched in normal-ICP CSF samples relative to high-ICP patient CSF showing the top 15 enriched GO terms and their relative significance by depth of color. Enrichment is shown on the x axis, and false discovery rate (FDR) on the y axis.

