FIGURE 5.

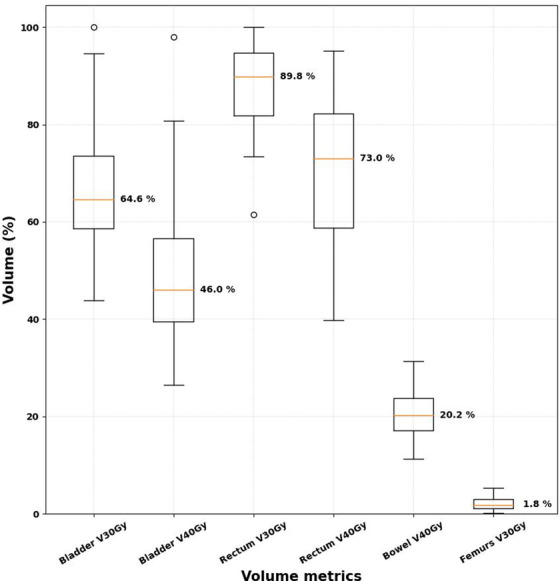
Boxplots for the normal structure dose–volume metrics for the 35 volumetric modulated arc therapy plans. The median values for the volume metrics are indicated next to each boxplot

Boxplots for the normal structure dose–volume metrics for the 35 volumetric modulated arc therapy plans. The median values for the volume metrics are indicated next to each boxplot