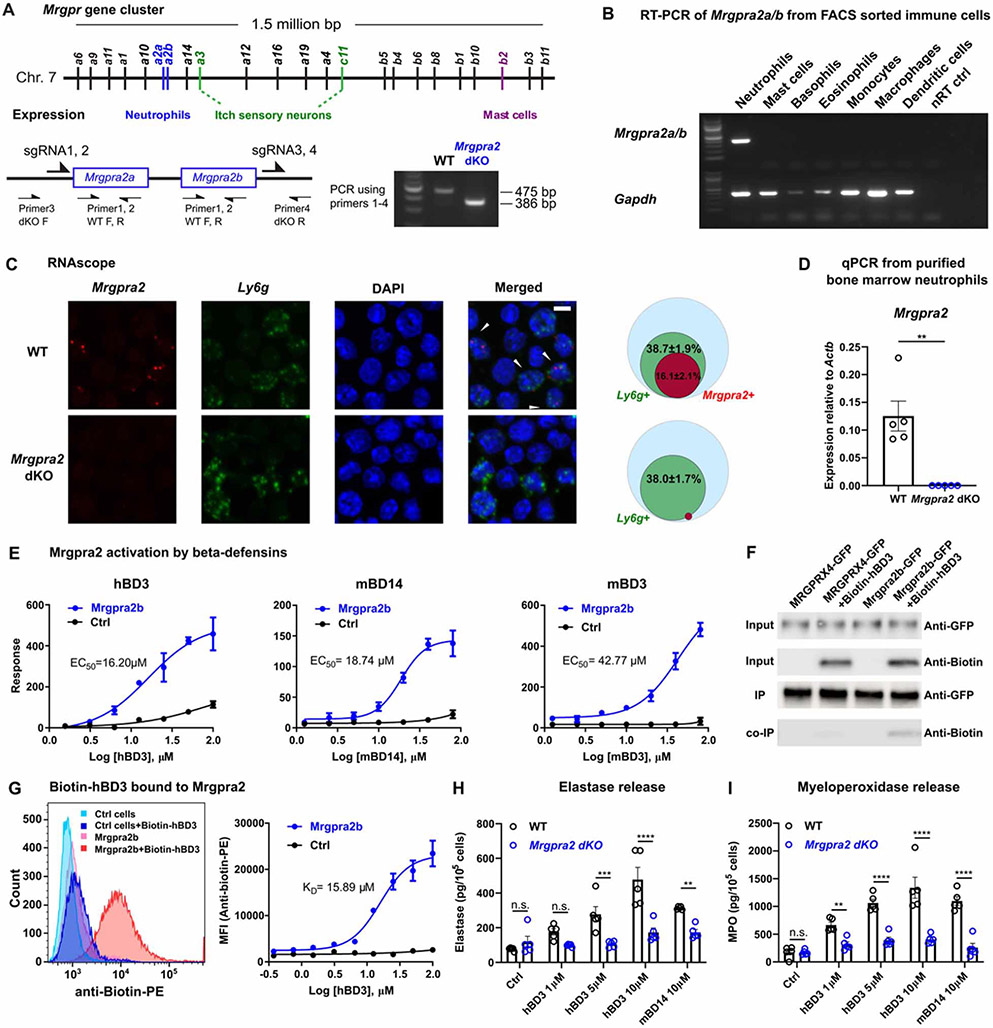
Figure 1. Mrgpra2a/b were neutrophil-specific receptors for defensi.
(A) Schematic illustration of the Mrgpr gene cluster on mouse Chromosome 7 and cellular expression specificities of a few well-studied members of the gene family. Mrgpra2a and a2b were deleted by CRISPR/cas9 using four gRNAs flanking the two genes, removing the entire genomic region. PCR genotyping using primers 1-4 as indicated in the diagram detects a WT band of 475 base pairs and an Mrgpra2 dKO mutant band of 386 base pairs.
(B) RT-PCR gel showing expression of Mrgpra2 and housekeeping gene Gapdh in FACS-sorted neutrophils, mast cells, basophils, eosinophils, monocytes, macrophages, dendritic cells, and the no reverse transcriptase control (nRT Ctrl) of the neutrophil sample.
(C) Representative RNAscope in situ hybridization images of bone marrow cells labeled using probes for Mrgpra2 (red), Ly6g (green), and DAPI (blue). Arrowheads point to Mrgpra2+; Ly6g+ neutrophils. Scale bar=5 μm. Venn diagrams depict percentages of Ly6g+ (green) and Mrgpra2+ (red) cells in all bone marrow cells (blue). n=3
(D) qPCR of mRNA from purified bone marrow neutrophils showed that Mrgpra2 were expressed highly in WT neutrophils but deleted from Mrgpra2 dKO neutrophils. n=5
(E) HEK cells expressing Mrgpra2b activation by hBD3 (EC50=16.2μM), mBD14 (EC50=18.74μM) and mBD3 (EC50=42.77μM) as determined by FLIPR intracellular calcium mobilization assay. n=4-9
(F) Western blot showing biotin-hBD3 being co-immunoprecipitated (co-IP) by Mrgpra2b-GFP. MRGPRX4-GFP (negative control) and Mrgpra2b-GFP were pulled down using anti-GFP beads, biotin-hBD3 was co-precipitated only with Mrgpra2b-GFP but not MRGPRX4-GFP.
(G) Dissociation constant (KD=15.89μM) between biotin-hBD3 and Mrgpra2b determined by flow cytometry. Left, representative flow cytometry histogram showing control HEK cells (blue) and Mrgpra2b-GFP-expressing cells (red) incubated with (darker shades) and without (lighter shades) biotin-hBD3 (100μM). Right, quantification of mean fluorescent intensity (MFI) of PE-anti-biotin showing the amount of biotin-hBD3 bound to the cells at each concentration. n=6
(H-I) hBD3 and mBD14 triggered WT neutrophils to release elastase (H) and myeloperoxidase (I) (black). Neutrophils purified from Mrgpra2 dKO animals did not respond to hBD3 stimuli (blue). n=5
Results are presented as mean ± SEM from at least three independent experiments. **p < 0.01, ***p < 0.001, ****p < 0.0001, n.s. not significant by two-tailed unpaired Student’s t test (D) or two-way ANOVA (H-I).
See also Figure S1.

