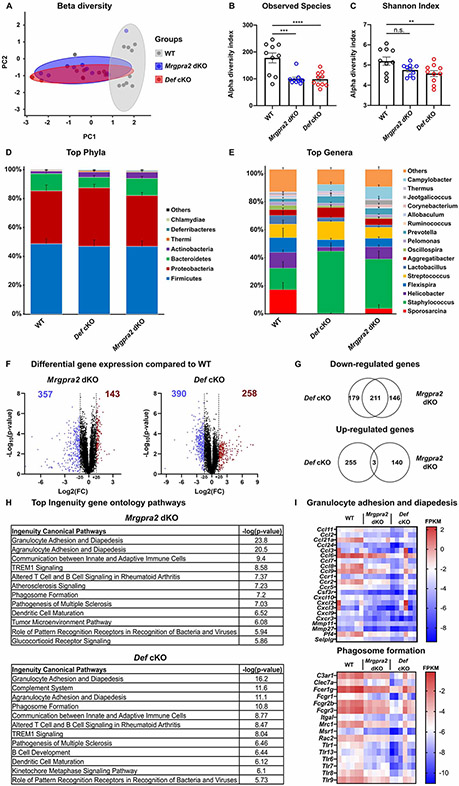
Figure 3. Def and Mrgpra2 mutant animals had altered skin microbiomes.
(A-E) 16S sequencing analysis of microbial communities on the skin of WT, Mrgpra2 dKO and Def cKO mice. n=10
(A) Principal coordinates analysis showed that the clustering of Mrgpra2 dKO (blue) and Def cKO (red) microbial communities overlapped with each other but were distinct from WT (grey).
(B) Total numbers of bacterial species observed in WT (black), Mrgpra2 dKO (blue), and Def cKO (red) skin swab samples.
(C) Shannon indices of WT (black), Mrgpra2 dKO (blue), and Def cKO (red) skin swab samples.
(D-E) Stacked bar charts depicting the relative abundance of top phyla (D) and top genera (E) in WT, Mrgpra2 dKO and Def cKO skin microbiota.
(F-I) RNA-seq analysis of gene expression in naïve skin of WT, Mrgpra2 dKO, and Def cKO mice. n=6
(F) Volcano plots illustrating genes with significantly down- (blue) or up-regulated (red) expression in the Mrgpra2 dKO (left) or Def cKO (right) naïve skin compared to WT.
(G) Top: Venn diagram showing overlap of down-regulated gene sets between Mrgpra2 dKO and Def cKO. Bottom: Very few overlap in the up-regulated gene sets.
(H) Top altered Ingenuity gene ontology pathways in Mrgpra2 dKO (top) and Def cKO (bottom) naïve skin compared to WT.
(I) Heat maps depicting fragments per kilobase per million mapped reads (FPKM) counts of genes related to granulocyte adhesion and diapedesis (top) and phagosome formation (bottom). n=6
Results are presented as mean ± SEM from one experiment. *p < 0.05, **p < 0.01, ***p < 0.001, n.s. not significant by one-way ANOVA.

