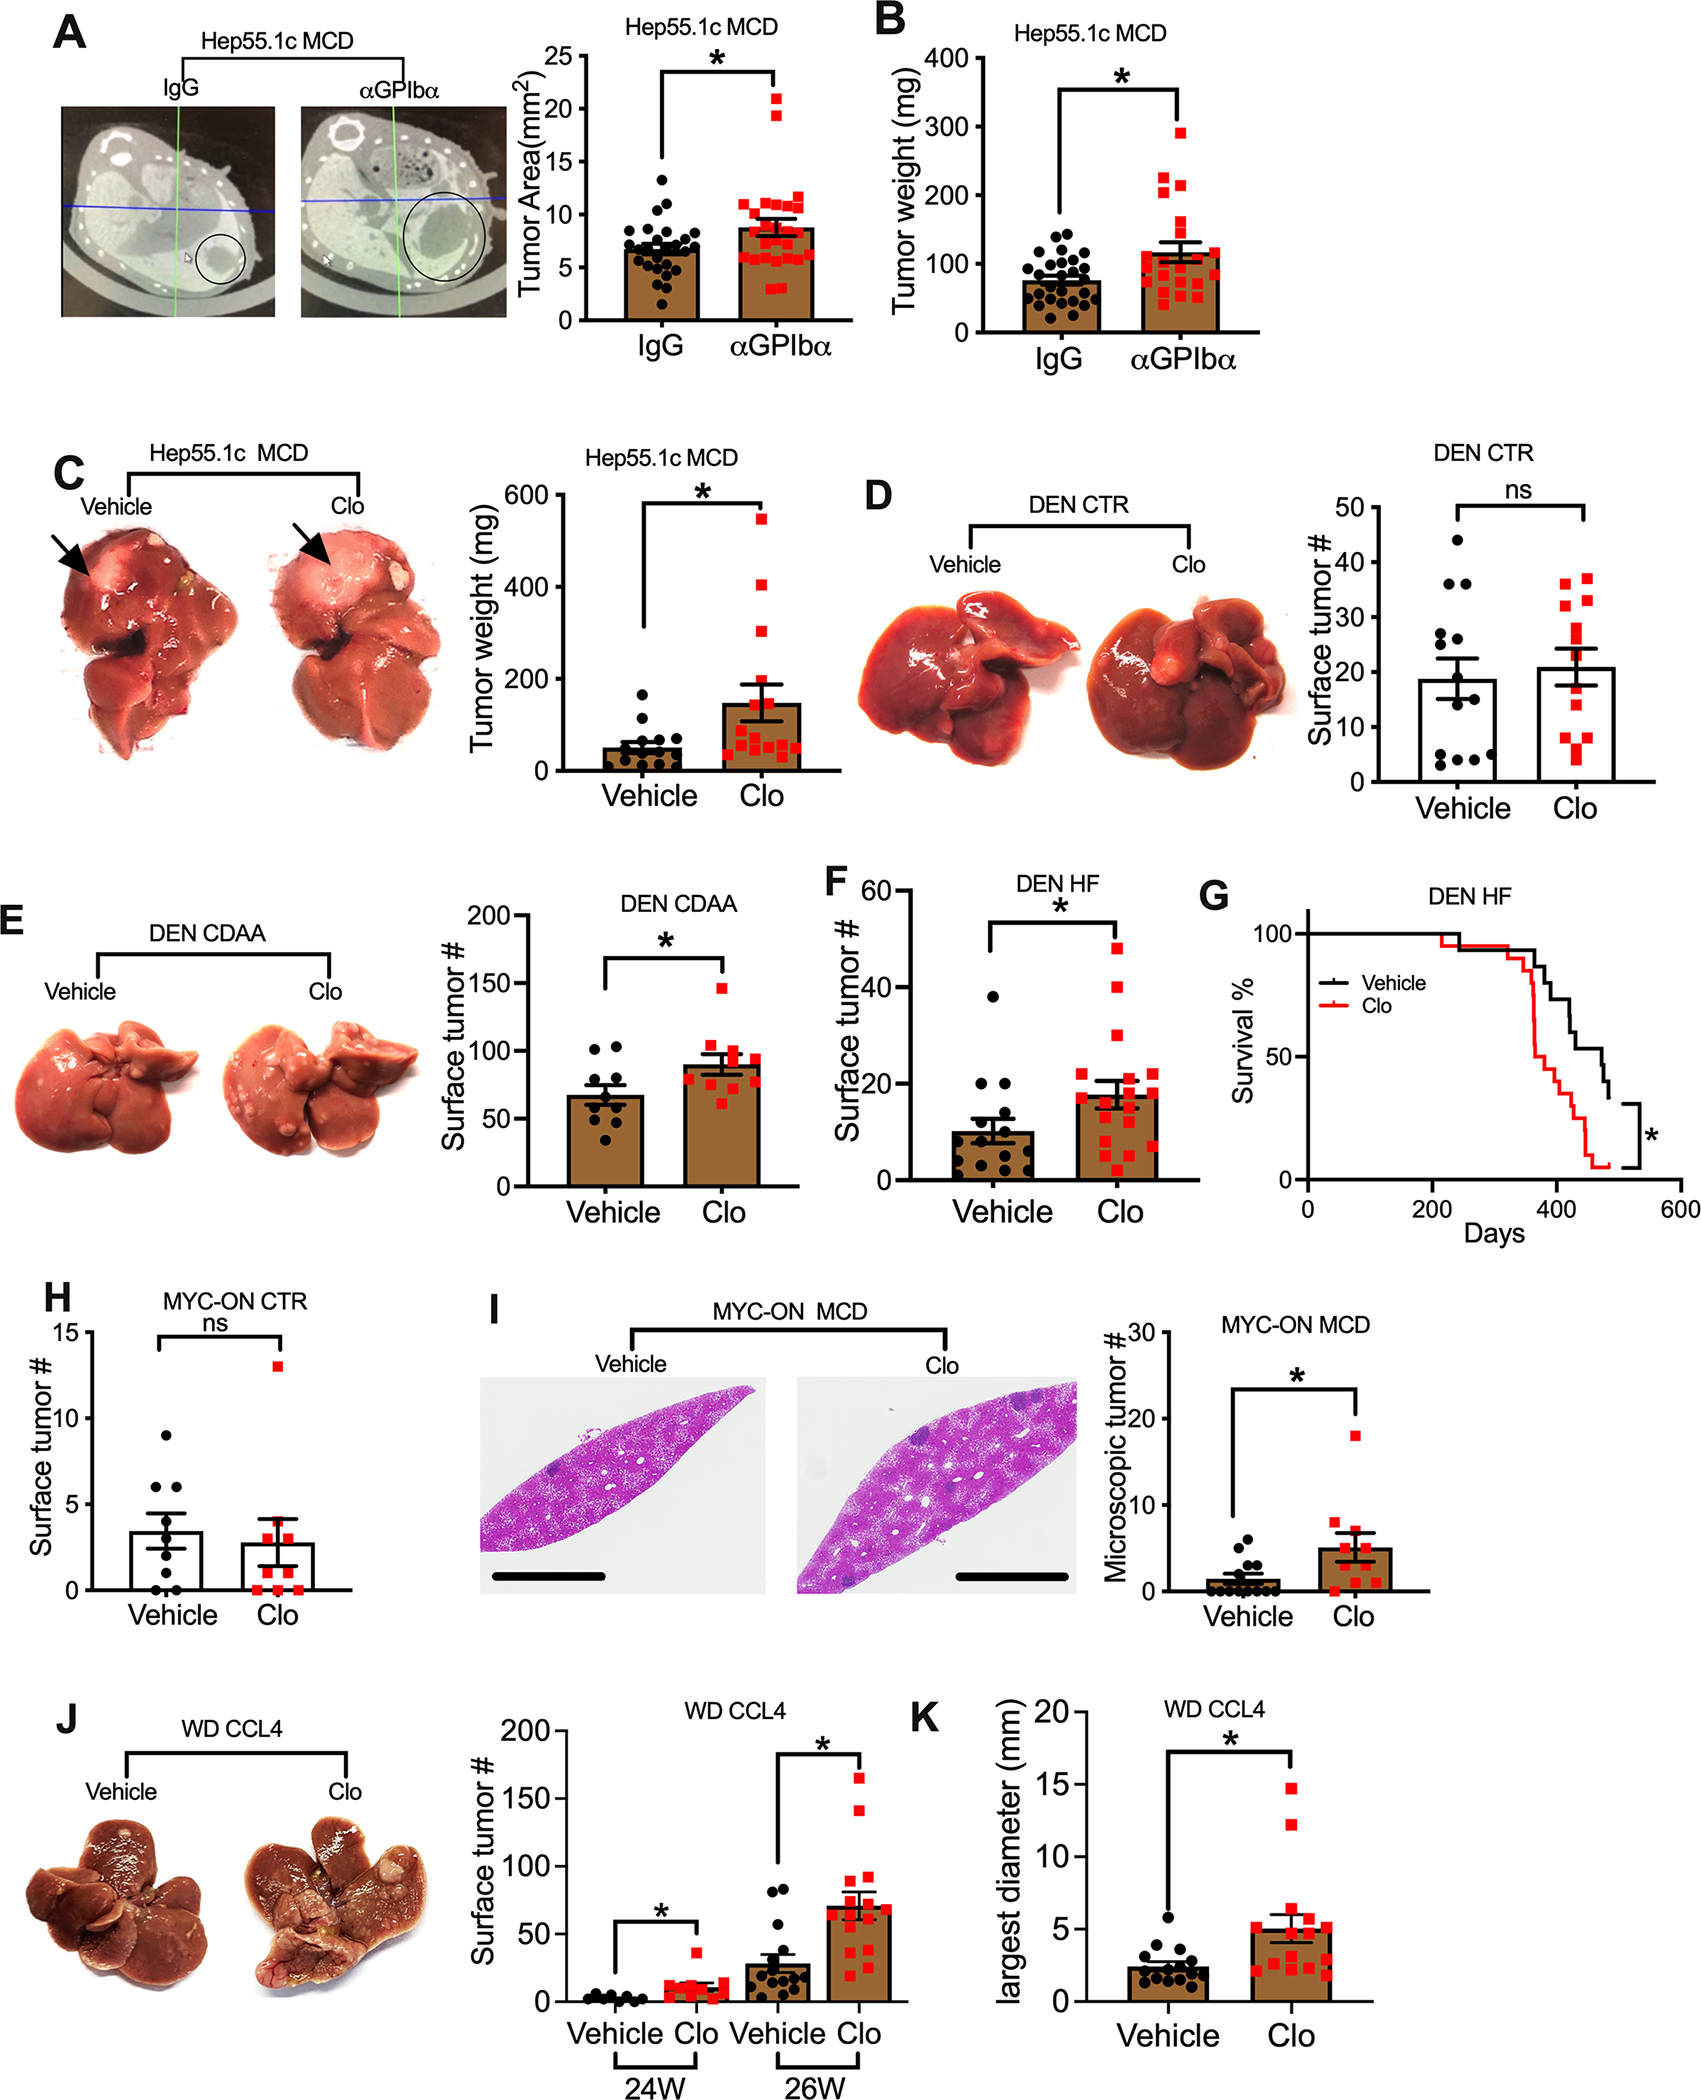
Figure 1. Platelet depletion or P2Y12 inhibiton accleates HCC in NAFLD.

(A, B) Intrahepatic Hep55.1c tumor cells were implanted into MCD diet-fed mice. After tumor implantation, mice were given i.p. injection of 50 μg αGPIb antibody or IgG control every 3 days. Tumor growth was monitored by microCT scan at day 7 after tumor injection (A) or by weight at the experimental end point (B). Data are presented as mean ± s.e.m. from three independent experiments. n=26, *P <0.05, Student’s t-test.
(C) Hep55.1c tumor cells were implanted into livers of MCD diet-treated mice with or without clopidogrel (Clo) treatment for 3 weeks. Mice were euthanized, and liver tumor weight was measured. Representative images are shown. Data are presented as mean ± s.e.m. from two independent experiments. n=15, *P <0.05, Student’s t-test.
(D) DEN injected mice kept on control diet (CTR) were were treated with clopidogrel or vehicle for 6 months. Mice were euthanized and liver surface tumor nodules were counted. Representative liver images were shown. Cumulative data are presented as mean ± s.e.m, n=14.
(E) DEN mice fed with CDAA diet and clopidogrel or vehicle for 6 month. Liver surface tumor nodules were counted. Representative liver images are shown. Cumulative data are presented as mean ± s.e.m, n=10. *p<0.05, Student’s t-test.
(F) DEN mice fed with hight fat (HF) diet were treated with clopidogrel or vehicle for 5 months. Liver surface tumor nodules were counted. Cumulative data are presented as mean± s.e.m, n=15 for vehicle, 18 for Clopidogrel. *P <0.05, Student’s t-test.
(G) DEN mice were fed with hight fat (HF) diet for 5 months, then mice were given clopidogrel or vehicle. Survival of HCC bearing mice was monitored. n=20 for Clo and 15 for vehicle. *p<0.05, Log-rank Mantel-Cox test.
(H) MYC-ON mice fed on control diet were treated with clopidogrel or vehicle for 8 weeks. Liver surface tumor nodules were counted. Cumulative data are presented as mean ± s.e.m. n=9.
(I) MYC-ON mice fed with MCD diet were treated with clopidogrel or vehicle for 4 weeks. Representitave images of H&E staining of liver sections are shown. The scale bars represent 2 mm. Microscopic tumor leisions were counted, and cumulative data are presented as mean ± s.e.m. n=13 for vehicle, 10 for Clopidogrel. *P <0.05, Student’s t-test.
(J, K) Representative liver images and liver surface tumor count of western diet-CCL4 treated male C57BL/6 mice given clopidogrel or vehicle (J). Largest tumor diameter of each mouse was measured at 26-week time point (K). Data are presented as mean ± s.e.m. n=8 for vehicle 24W,10 for clopidogrel 24W, 15 for vehicle 16W or clopidogrel 26W. *P <0.05, Student’s t-test.
See also Figure S1.
