
Figure 4. CD40 and CD8+T cells mediate the platelet dependent tumor inhibition.
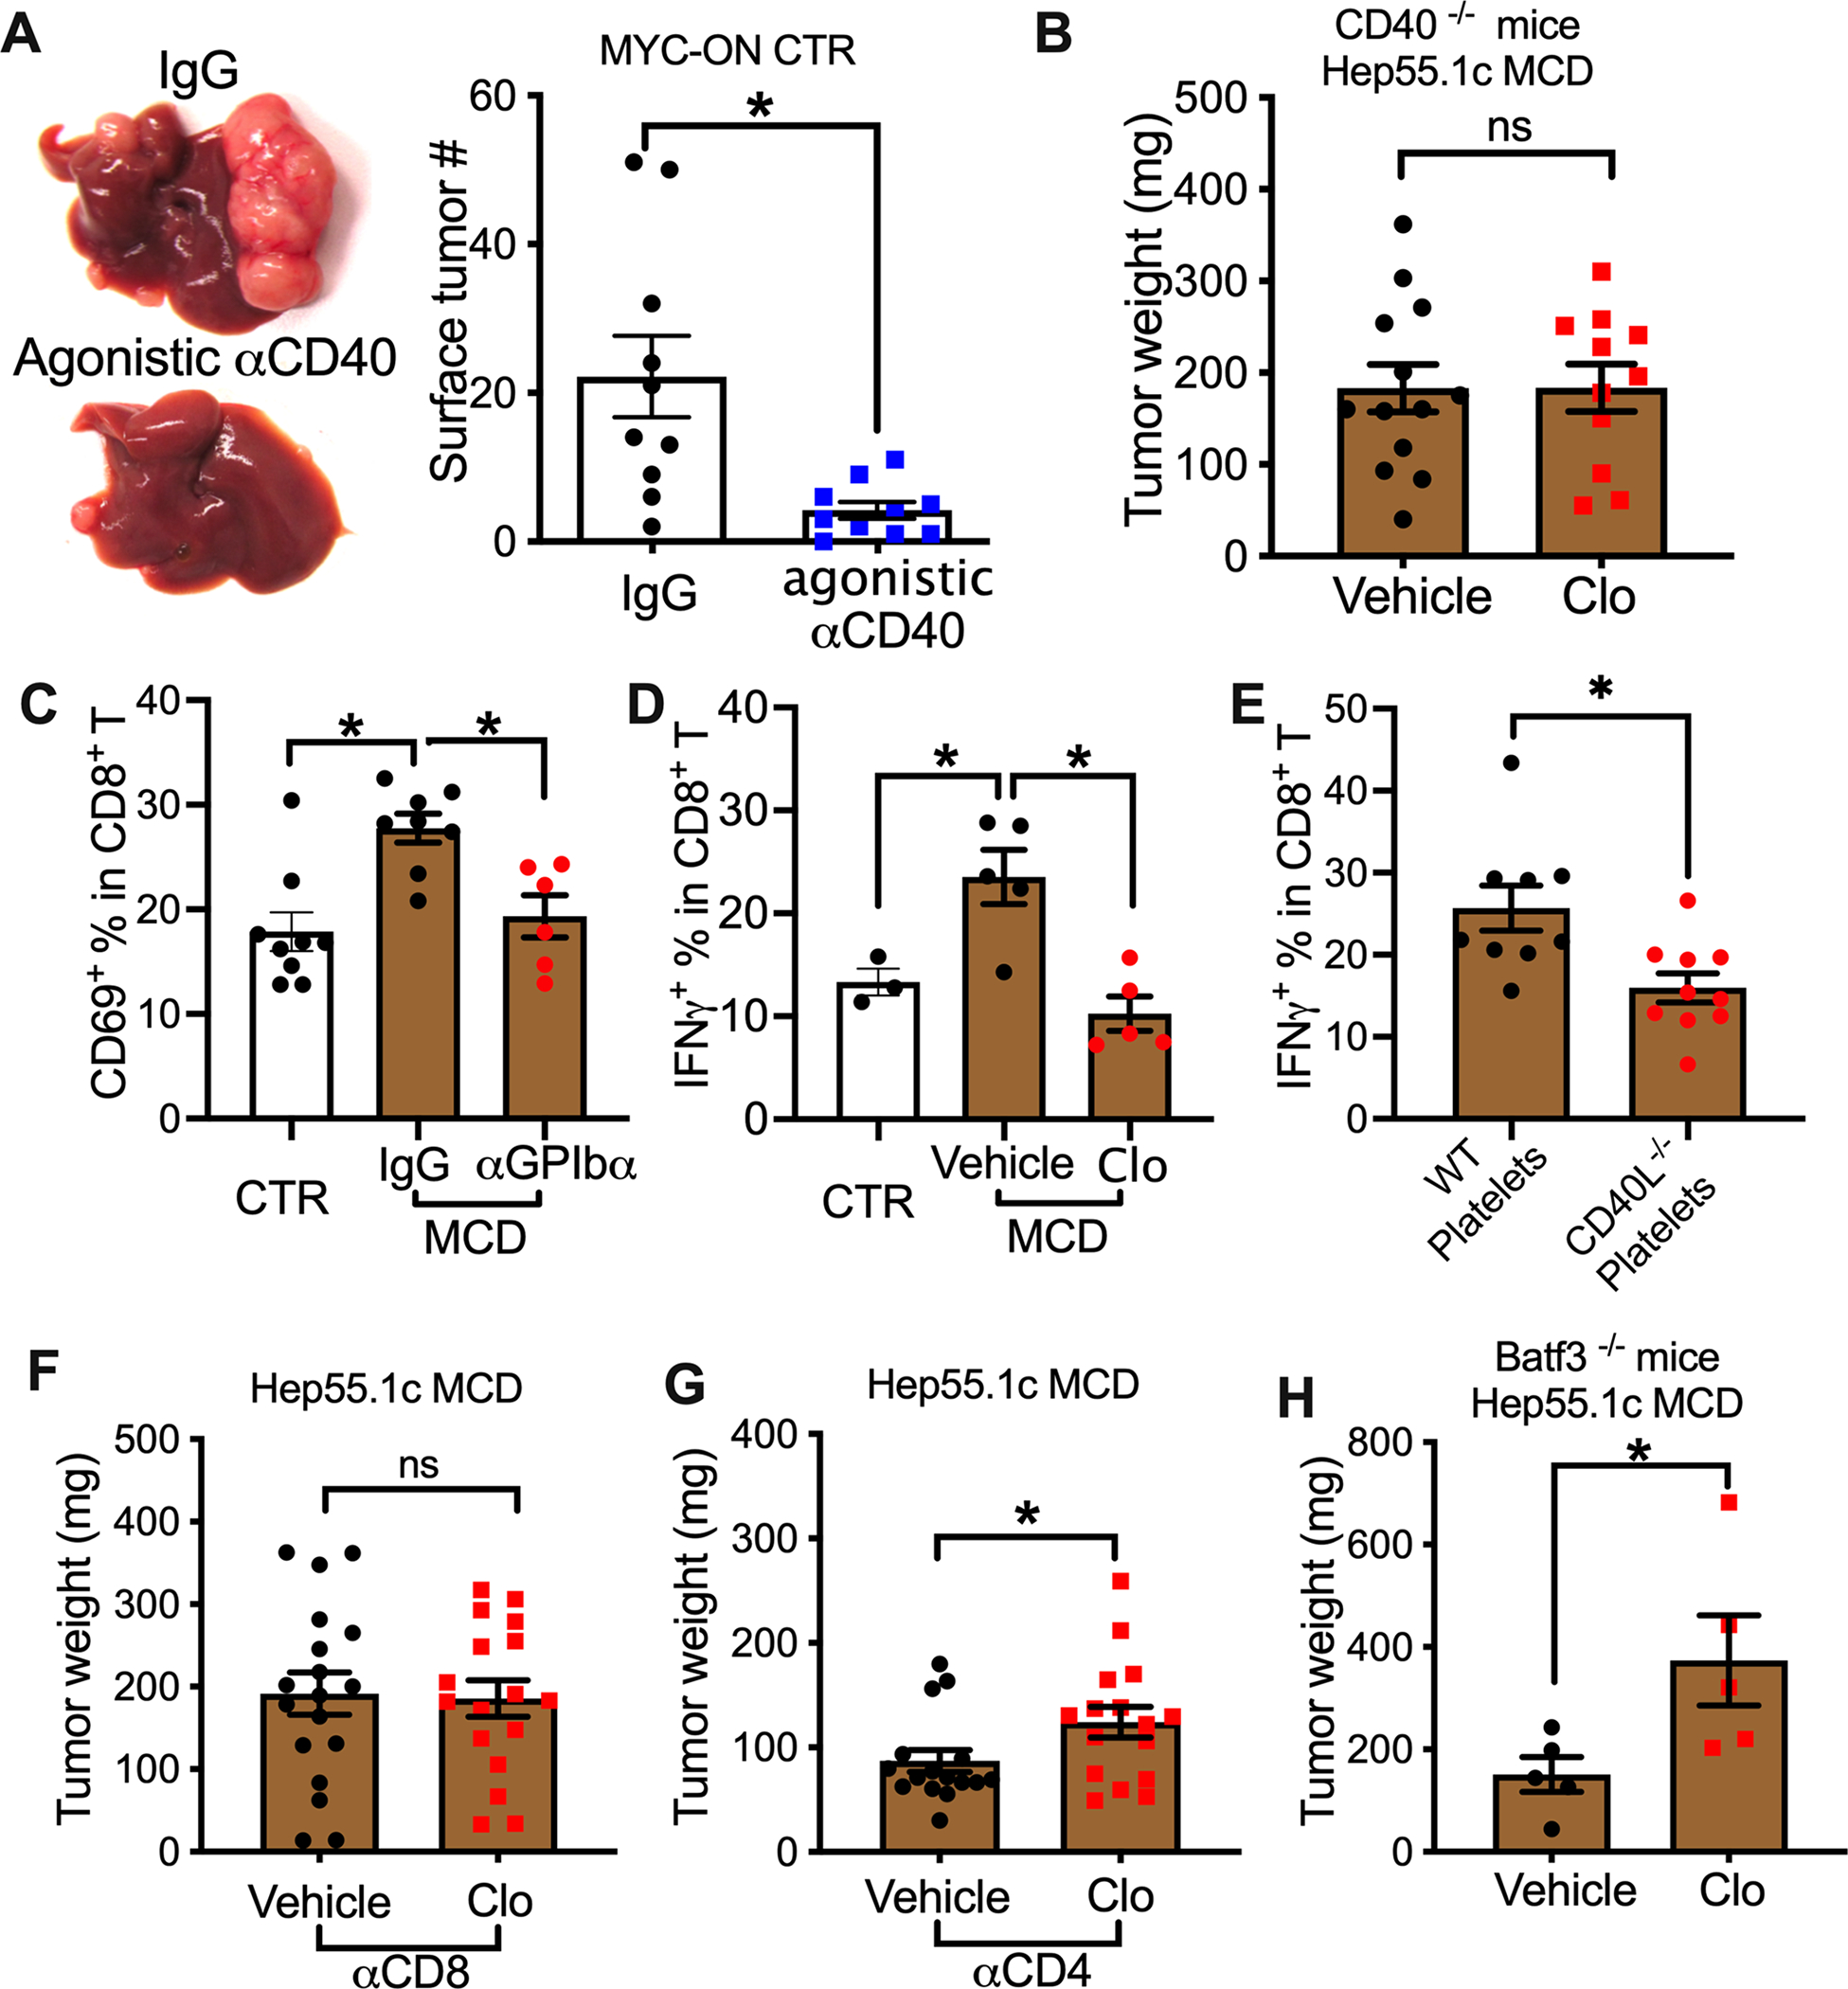
(A) Control diet fed-MYC-ON mice were treated with agonistic CD40 antibody or control IgG. Representative liver images are shown. Liver surface tumor numbers were measured. Cumulative data are shown as mean± s.e.m. n=10, *P <0.05, Student’s t-test.
(B) Hep55.1c tumor cells were orthotopically injected into the livers of CD40−/− mice fed with MCD diet together with or without clopidogrel. Three weeks later, mice were euthanized, and liver tumor weight was measured. Data are presented as mean± s.e.m. of two independent experiments. n=13 for vehicle and 11 for Clo.
(C) MCD diet-fed mice were injected i.p. with α-GPIbα or IgG control. CD69 expression on intrahepatic CD8+ T cells was measured by flow cytometry. Data are presented as mean± s.e.m. from two independent experiments. n=9 for control, 8 for MCD IgG, and 6 for MCD α-GPIbα. *P < 0.05, one-way ANOVA.
(D) IFNγ expression of intrahepatic CD8+ T cells from MCD diet-fed mice treated with or without clopidogrel. Data are presented as mean± s.e.m. n=3 for control, 5 for MCD vehicle, and 5 for MCD Clo. *P < 0.05, one-way ANOVA.
(E) IFNγ expression of intrahepatic CD8+ T cells was measured from the mice that received adoptively transferred platelets described in Fig. 3F. Data are presented as mean± s.e.m. of two independent experiments. n=9 for wt platelets and 10 for CD40L−/− platelets. *P <0.05, Student’s t-test.
(F,G) Hep55.1c tumor cells were implanted into livers of MCD diet-fed mice treated with or without clopidogrel, then tumor-bearing mice were injected i.p. with αCD8 (F) or αCD4 (G). Liver tumor burden was measured at end point. Data are presented as mean± s.e.m. from two independent experiments. n=20, *P <0.05, Student’s t-test.
(H) Hep55.1c tumor cells were orthotopically injected into the livers of Batf3−/− mice fed with the MCD diet together with or without clopidogrel. Liver tumor burden was measured at experimental end point. Data are presented as mean± s.e.m. n=5.
See also Figure S4.