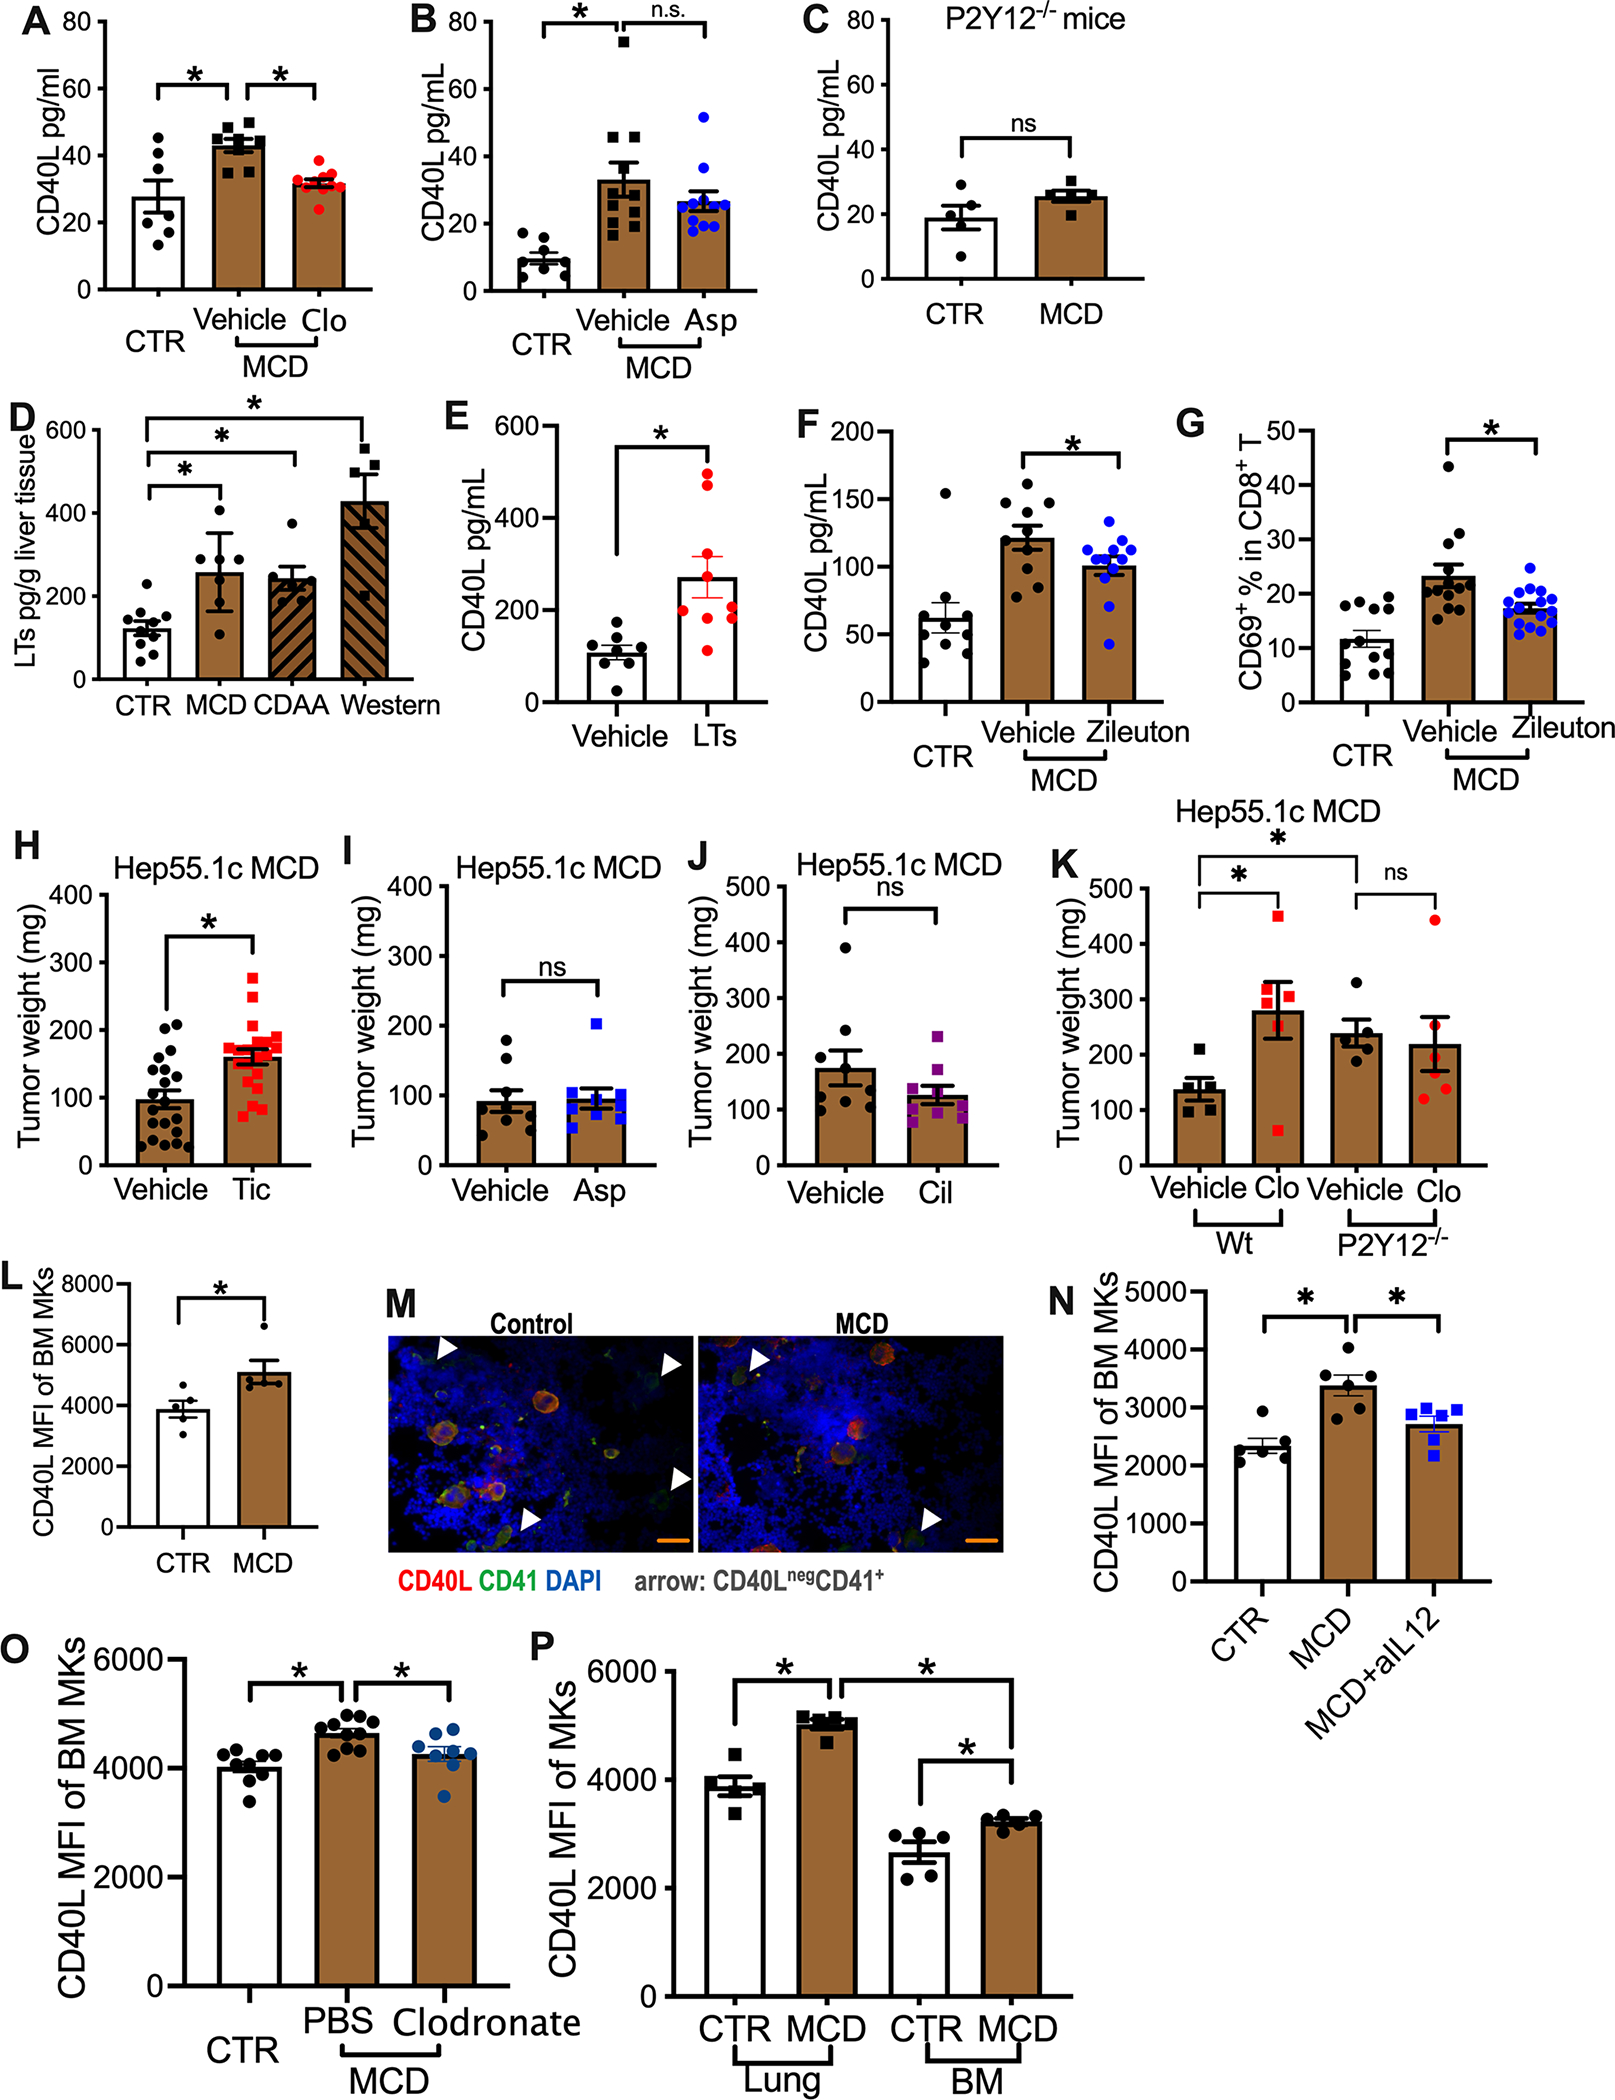
Figure 5. P2Y12 controls platelet CD40L release and HCC growth.

(A, B) Plasma CD40L levels of MCD-fed mice treated with or without clopidogrel (A) or aspirin (Asp) (B). Cumulative data are presented as mean± s.e.m. *P < 0.05, one-way ANOVA.
(C) P2Y12−/− mice were fed with MCD diet or control diet for 4 weeks. Plasma CD40L levels were measured. Cumulative data are presented as mean± s.e.m.
(D) Cysteinyl leukotrienes (LTs) levels in liver tissue lysates prepared from mice fed on MCD, CDAA or Western diet were measured by ELSIA. Data are presented as mean± s.e.m. n=10 for CTR, 5 for CDAA, 6 for Western, 7 for MCD. *P < 0.05, one-way ANOVA.
(E) Plasma CD40L levels of native mice injected i.v. with a mix of cysteinyl leukotrienes. Data are presented as mean± s.e.m. from two independent experiments. n=8 for vehicle, 9 for LTs. *P <0.05, Student’s t-test.
(F, G) Plasma CD40L levels (F) and intrahepatic CD8 T cell CD69 expression(G) of MCD diet-fed mice treated with or without zileuton. Data are presented as mean± s.e.m. *P < 0.05, one-way ANOVA.
(H-J) Hepatic hep55.1c tumor-bearing MCD diet-fed mice were treated with or without ticagrelor (Tic, H), aspirin (Asp, I) or cilostazol (Cil, J) for three weeks. Liver tumor burden was measured. Data are presented as mean± s.e.m. from two independent experiments. n=20 for ticagrelor study, n=9 for Aspirin or cilostazol study. *P <0.05, Student’s t-test.
(K) MCD diet-fed wildtype or P2Y12−/− mice with or without clopidogrel were given intrahepatic injection of hep55.1c tumor cells. Liver tumor burden was measured. Data are presented as mean± s.e.m. *P < 0.05, one-way ANOVA.
(L) CD40L expression levels of bone marrow megakaryocytes from mice fed with MCD or control diet were measured by flow cytometry. Data are presented as mean± s.e.m. from two independent experiments. *P <0.05, Student’s t-test.
(M) Bone marrow smears prepared from MCD or control diet-fed mice were subjected to immunohistochemistry staining of CD40L (red) and CD41 (green). Nuclei were stained by DAPI. Organ scale bars represent 200μM. Representative imagines are shown.
(N) MCD diet-fed mice were injected with IL-12-neutralizing antibody or IgG control. CD40L expression levels of bone marrow megakaryocytes were measured. Data are presented as mean± s.e.m. from two independent experiments. n=6, *P <0.05, one-way ANOVA.
(O) Clodronate liposome was used to deplete macrophage in MCD diet-fed mice. CD40L expression levels of bone marrow megakaryocytes were measured. Data are presented as mean± s.e.m. n=9 for CTR, 10 for MCD-PBS, 8 for MCD-Clodronate, *P <0.05, one-way ANOVA.
(P) Mice were fed with MCD diet or control diet. CD40L of lung and bone marrow megakaryocytes were measured. Data are presented as mean± s.e.m. from two independent experiments. n=5, *P <0.05, one-way ANOVA.
See also Figure S5.
