Figure 2:
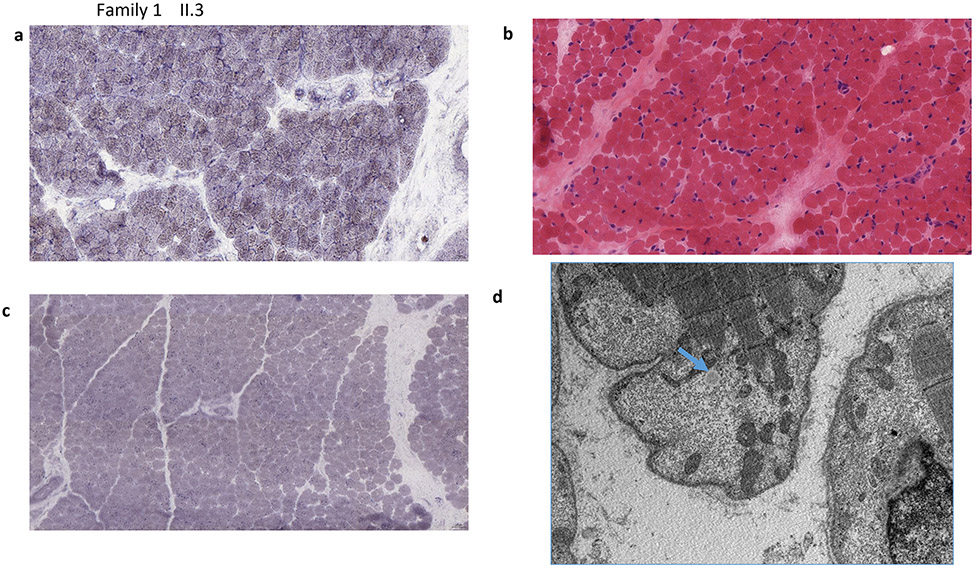
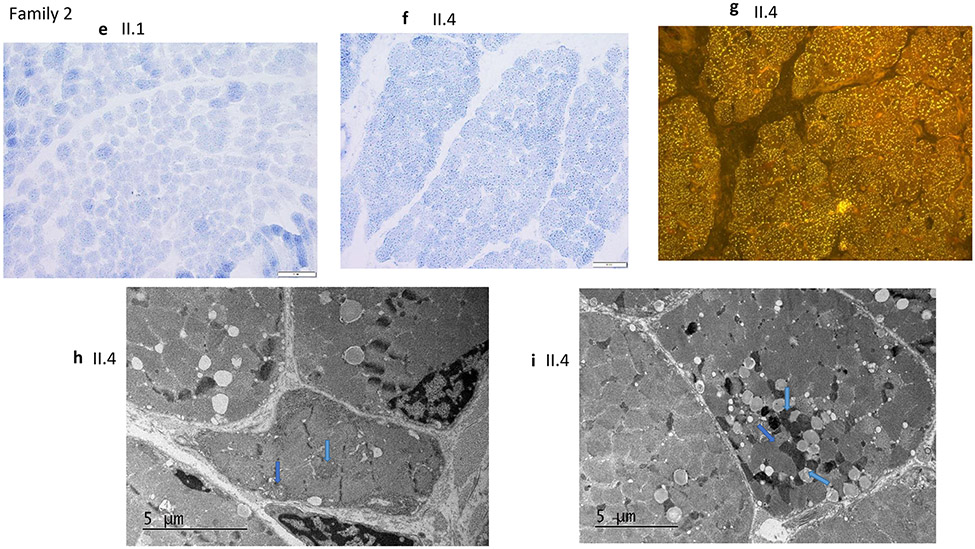
a-d) Muscle Biopsy results of affected individual (II.3) from family 1 . a) SDH (original magnification x400) Fiber size variation is increased. No ragged blue fibers were identified. b) SDH (original magnification x400) There are scattered hypotrophic fibers. No ragged blue fibers present, the staining intensity of SDH was mildly increased, suggesting increased density of mitochondria c) (Sudan Black, original magnification x400) A Sudan black stain revealed diffusely increased intracytoplasmic lipids. d) EM shows mitochondria are few, very irregular in shape and they are intermixed with glycogen not with lipid droplets (blue arrow). The increase of lipids seen with the Sudan Black stain is irregularly located and not present in this sub sarcolemnic area with some irregular-shaped mitochondria e-i) Muscle Biopsy results of the affected siblings (II.1, II.4) of family 2. e) II.1, SDH (original magnification x400) Fiber size variation is increased. No ragged blue fibers were identified. f)II.4, SDH (original magnification x400) There are scattered hypotrophic fibers. No ragged blue fibers present, while the staining intensity of SDH was felt to be mildly increased, suggesting increased density of mitochondria in fibers. g) II.4, (Nile Red, original magnification x400) A Nile red stain viewed under the fluorescent microscope reveals diffusely increased intracytoplasmic lipid. h,i) II.4, EM shows variably enlarged mitochondria intermixed with lipid droplets (arrows)


