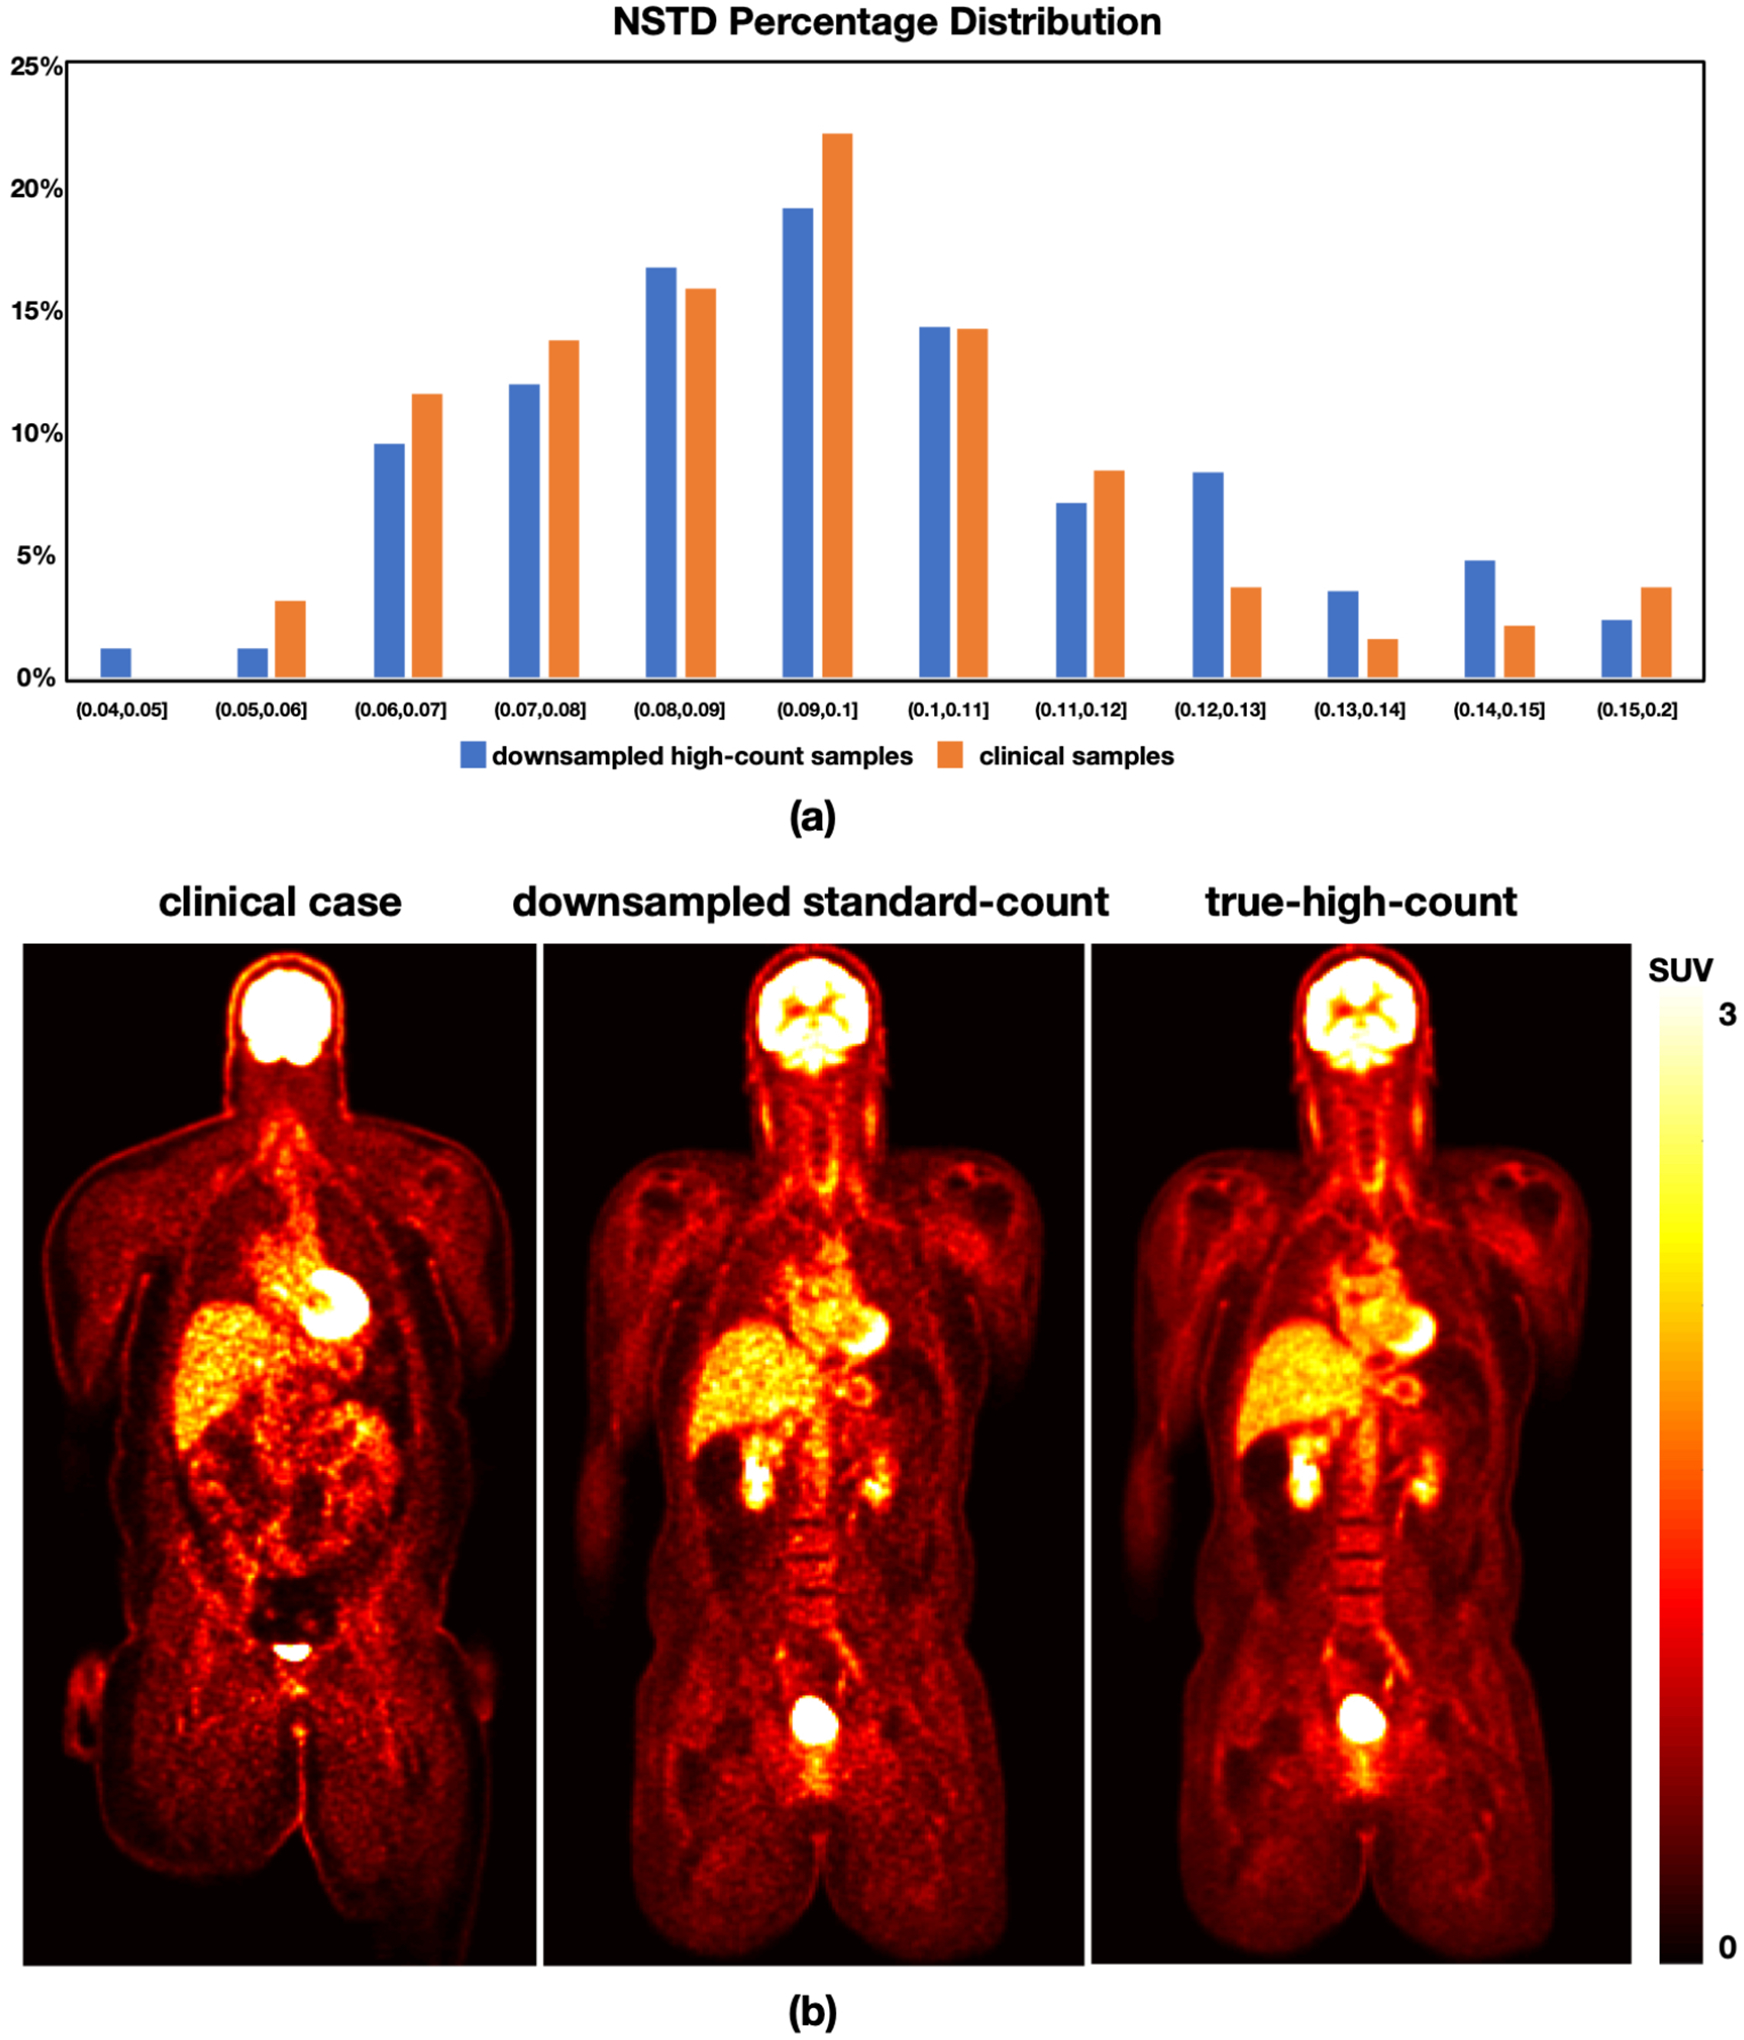
Figure 1:

(a) The histogram of NSTD in the rebinned multi-pass dynamic data and 195 clinical data. (b) Visualization of a clinical standard-count image (left) from a sample patient (male, BMI 40.2 kg· m2). A down-sampled standard-count image (middle) and the corresponding true-high-count image (right) from a sample subject (male, BMI 30.8 kg· m2) from the multi-pass dynamic datasets are provided as well.
