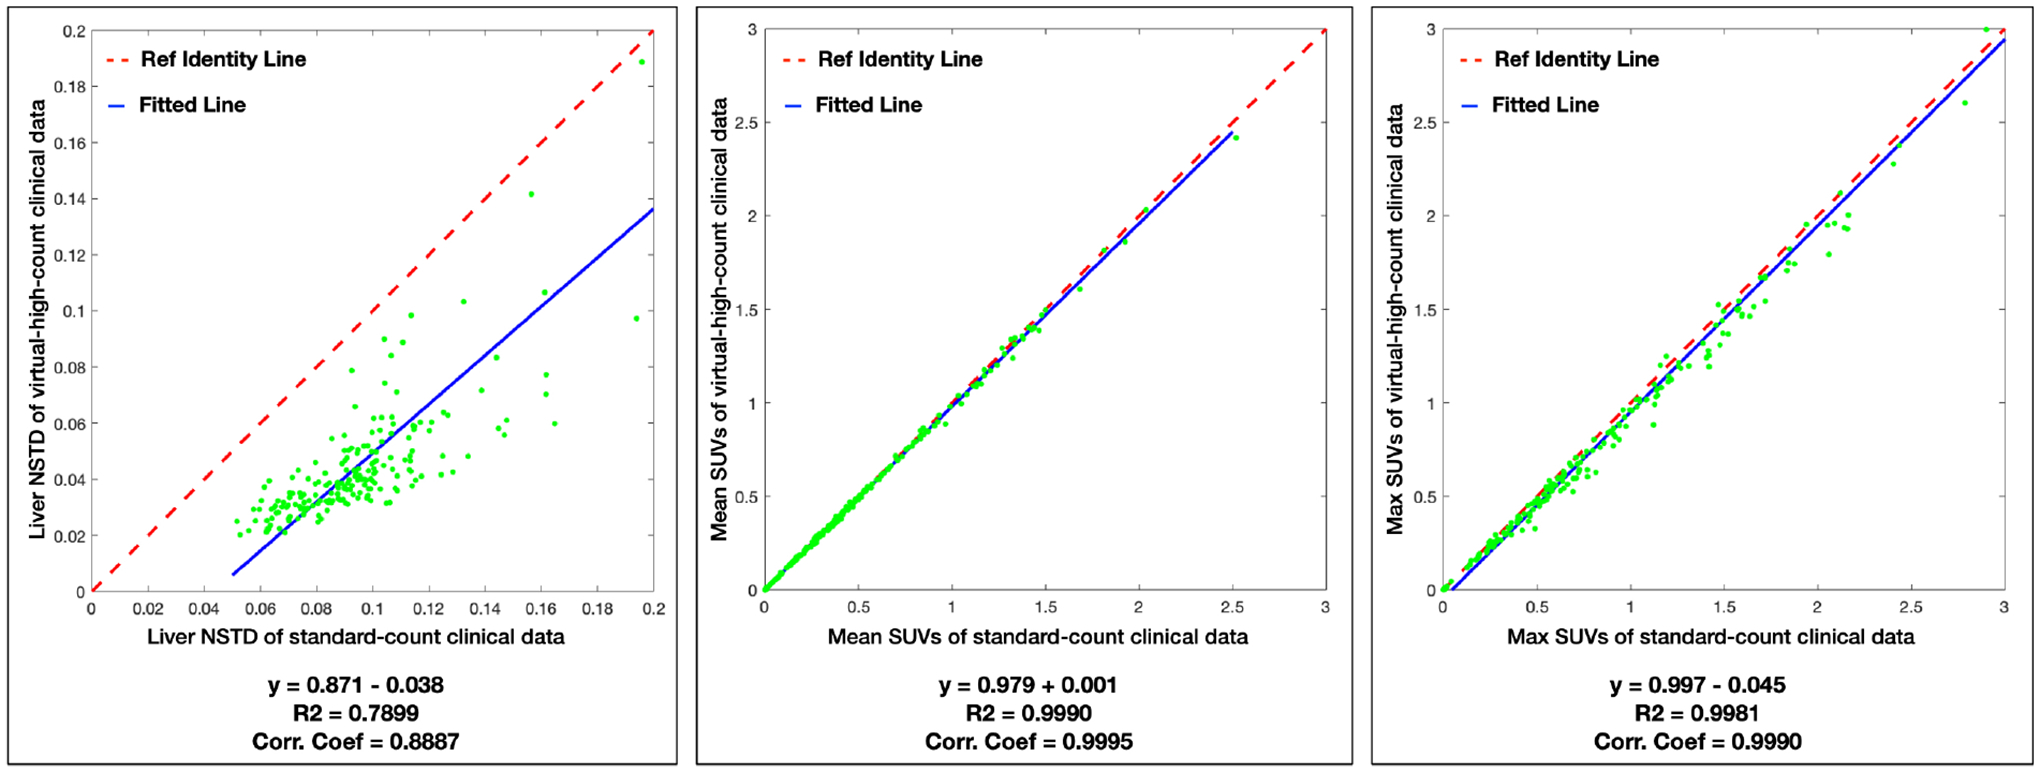
Figure 6:

The correlation and linear fitting of NSTD and mean/max SUVs of 215 hypermetabolic lesions between the standard-count and predicted virtual-high-count images for the 195 clinical data. The fitted function, coefficient of determination (R2), and correlation coefficients (Corr. Coef.) are listed below. The red dash line is the line of identity, and the blue line is the fitted line.
