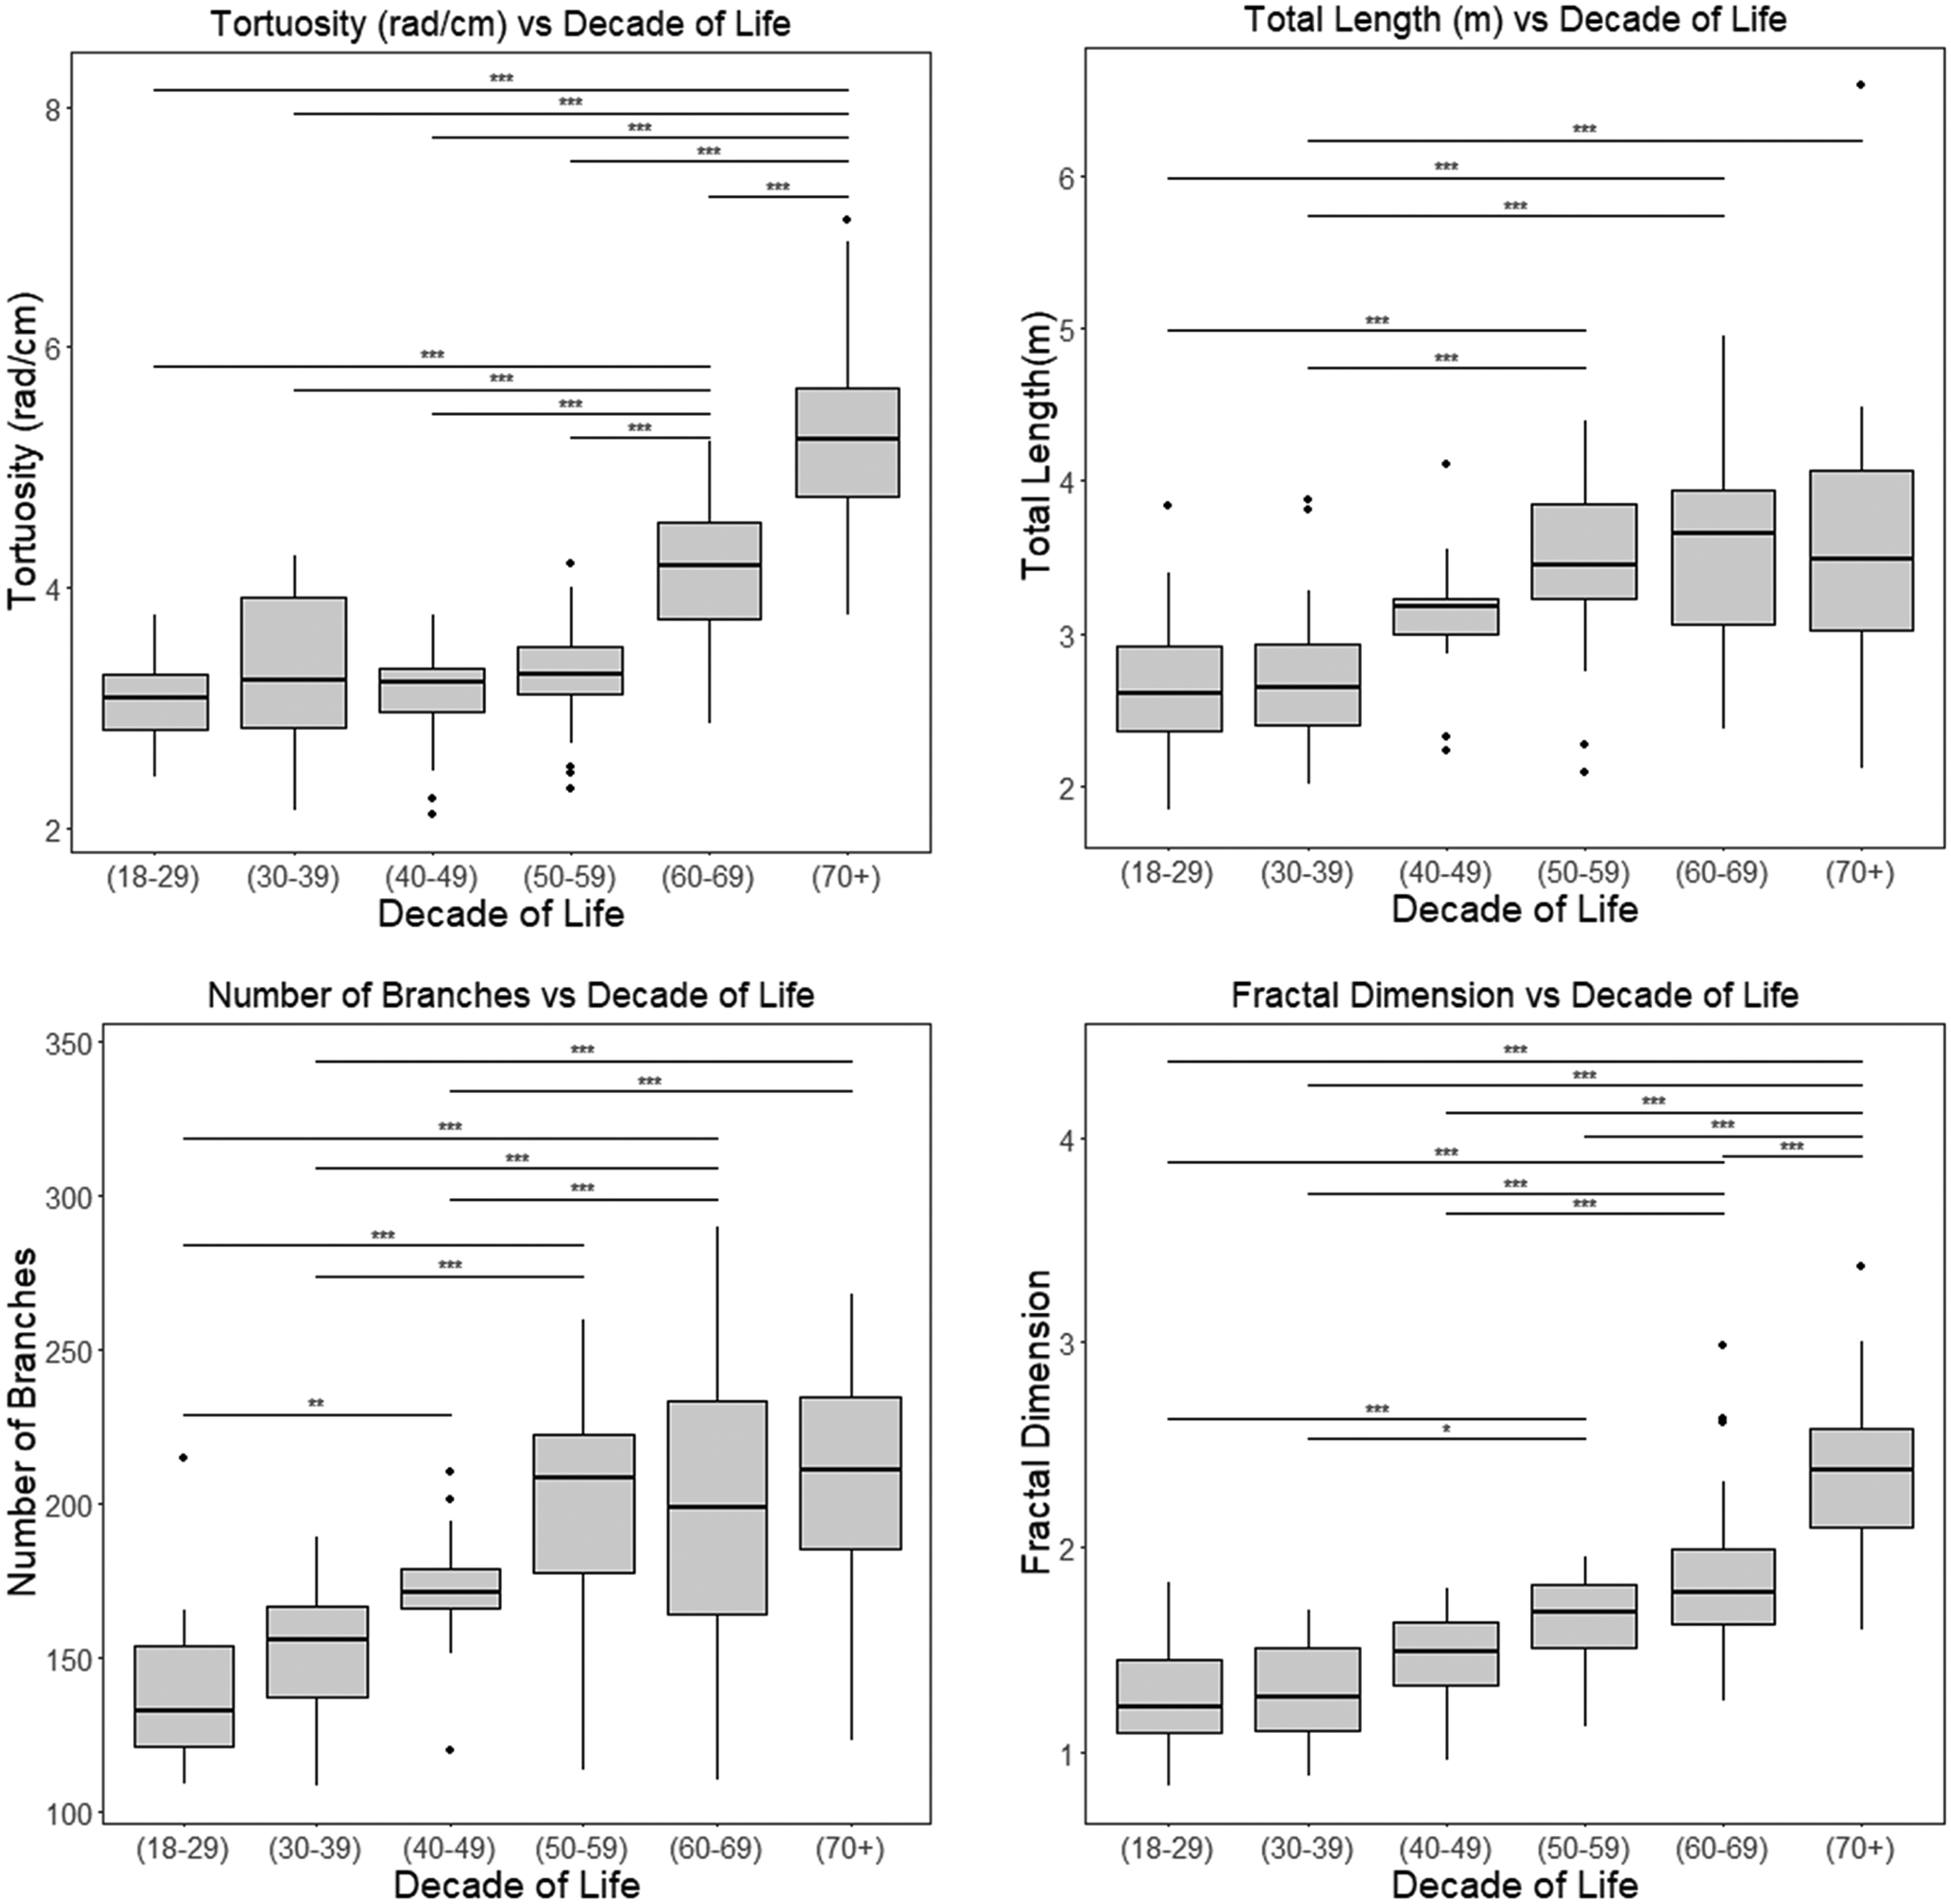
Figure 3.

Major findings of the effect of aging conducted on the healthy subjects from the atlas, demonstrating a significant change in vascular patterns with increasing age (in years) in certain vascular features. The ANOVA test results between age groups for the significantly different groups are represented by * for p<0.05, ** for p<0.01 and *** for p<0.001. The multi-group ANOVA had p<0.001 for tortuosity, number of branches and fractal dimension. rad: radians
