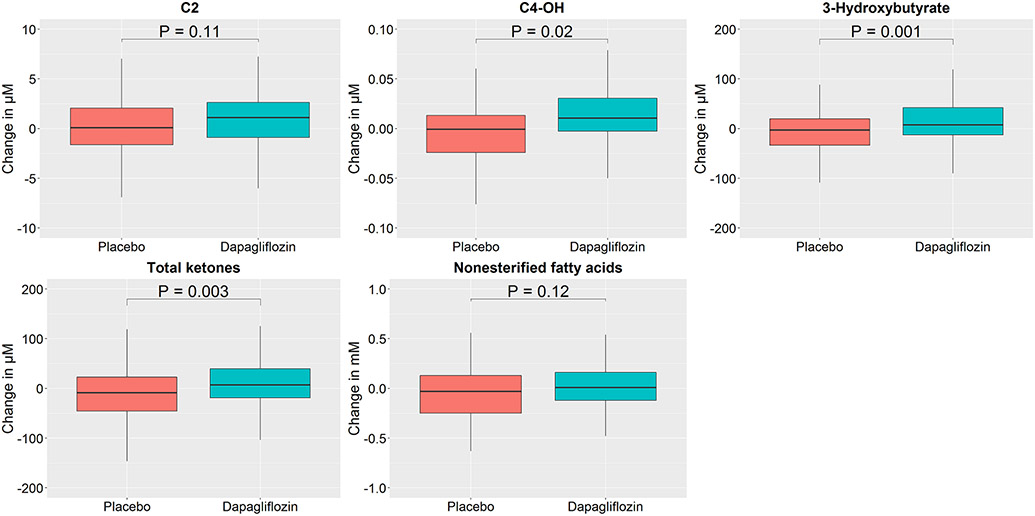
Figure 1: Box-and-whisker plots of changes in metabolite levels heavily loaded on factor 6 by treatment group.
Changes in individual metabolites heavily loaded on factor 6 are detailed using boxplots, stratified by treatment group. Outliers not depicted. All metabolite units are in μM, aside from non-esterified fatty acids (mmol/L). P-value shown for difference between groups. C2, Acetyl carnitine; C4-OH, 3-hydroxy-butyryl carnitine.

