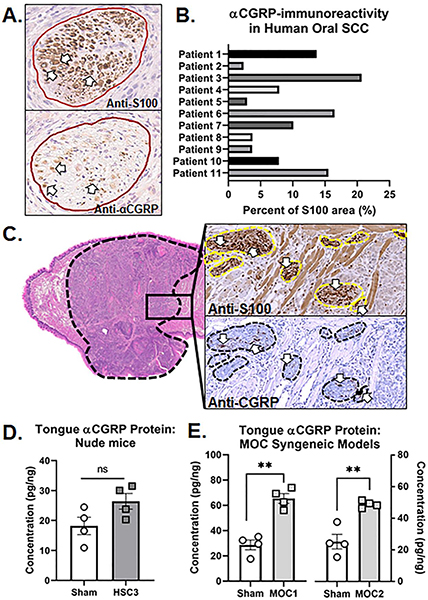
Figure 1. Anti-CGRP immunoreactivity (IR) in tissue from HNSCC patients and oral cancer mouse models.
A) Representative images of HNSCC tumor serial sections stained with either anti-S100 (top) or anti-CGRP (bottom). Nerve bundles are outline in red and positive stain is indicated by white arrows. Image magnification = 20x. B) Quantification of the percent of total αCGRP-IR nerve area relative to total S100-IR nerve area across tumor tissue sections from 11 HNSCC patients with PNI pathology reported by an oral and maxillofacial pathologist. Patient demographics are located in Table 1. C) Representative image of CGRP-IR in serial tumor sections stained with either hematoxylin and eosin (H&E, left, 4x magnification), S100 (right top), or CGRP (right bottom). Tumor is outlined in black and nerve bundles are outlined in yellow (top inset) and black (bottom inset). Positive stain is indicated by white arrows. Image magnification = 20x. αCGRP protein concentration in the tumor was measured in tongue tissue from (D) HSC3 tumor bearing athymic nude mice at post-inoculation day (PID) 28 compared to sham mice and in (E) MOC1 (PID 35) and MOC2 (PID 14) tumor bearing C57Bl/6 mice compared to sham mice by ELISA (n=4/group). αCGRP concentration was normalized to total protein isolated in the tongue tumor tissue for each sample. Student’s t test **p<0.01.

