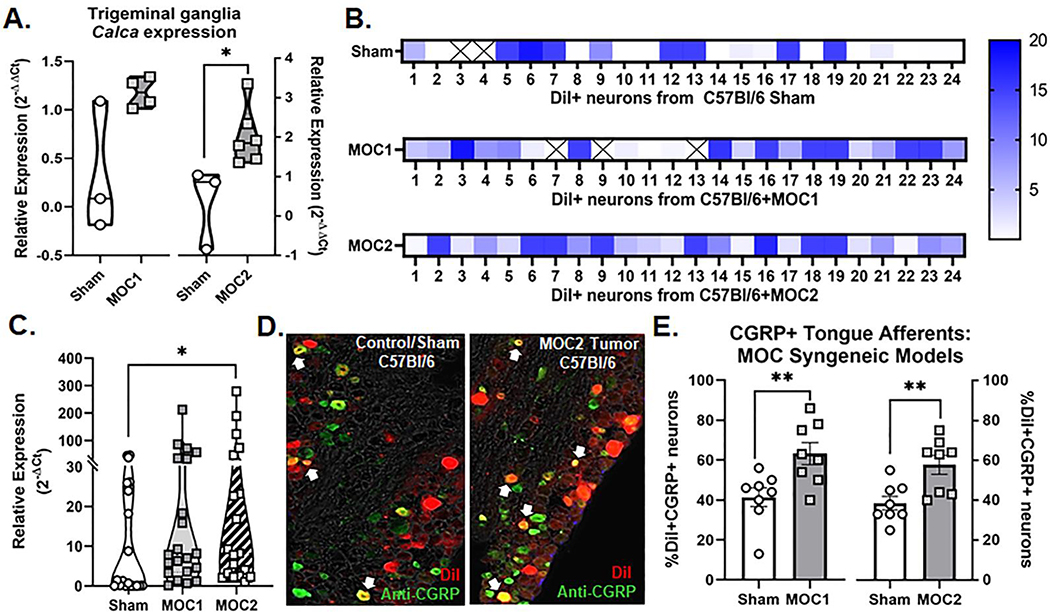
Figure 2. CGRP expression in tongue trigeminal ganglia neurons (TGN).
A) Quantification of Calca gene expression in whole trigeminal ganglia isolated from sham (n=3/time point), MOC1-tumor bearing mice (n=4, PID 35), and MOC2-tumor bearing mice (n=6, PID 14) using RT-PCR. Expression was normalized to housekeeping gene GusB and then to average expression in sham mice. Student’s t test *p<0.05. B) Calca gene expression from retrogradely labeled (DiI+) tongue-innervating TG neurons from sham C57Bl/6 mice (n=24, 2 mice), MOC1-tumor bearing mice (n=24, 2 mice PID 35), and MOC2-tumor bearing mice (n=24, 2 mice PID 14) that were manually picked to perform single-cell PCR. Gene expression was calculated for relative mRNA expression for each cell for each gene. Gusb was used as an internal control. Data are presented as heatmap for each gene for each cell. Boxes containing an X indicate no detectable expression (CT value > 38) for that cell. C) The relative expression distribution across treatment group was compared using Kruskal-Wallis test *p<0.05. D) Representative images of retrograde labeling (red) and anti-CGRP immunoreactivity (green) in the mandibular branch of the TG from a sham C57Bl/6 mouse and a MOC2-tumor bearing mouse PID 14. E) Quantitative analysis of DiI-positive tongue-innervating neurons with distinct visible nuclei with CGRP-IR in TG sections from sham (n=8/time point), MOC1-tumor bearing mice (n=8, PID 35), and MOC2-tumor bearing mice (n=8, PID 14). Student’s t test **p<0.01.

