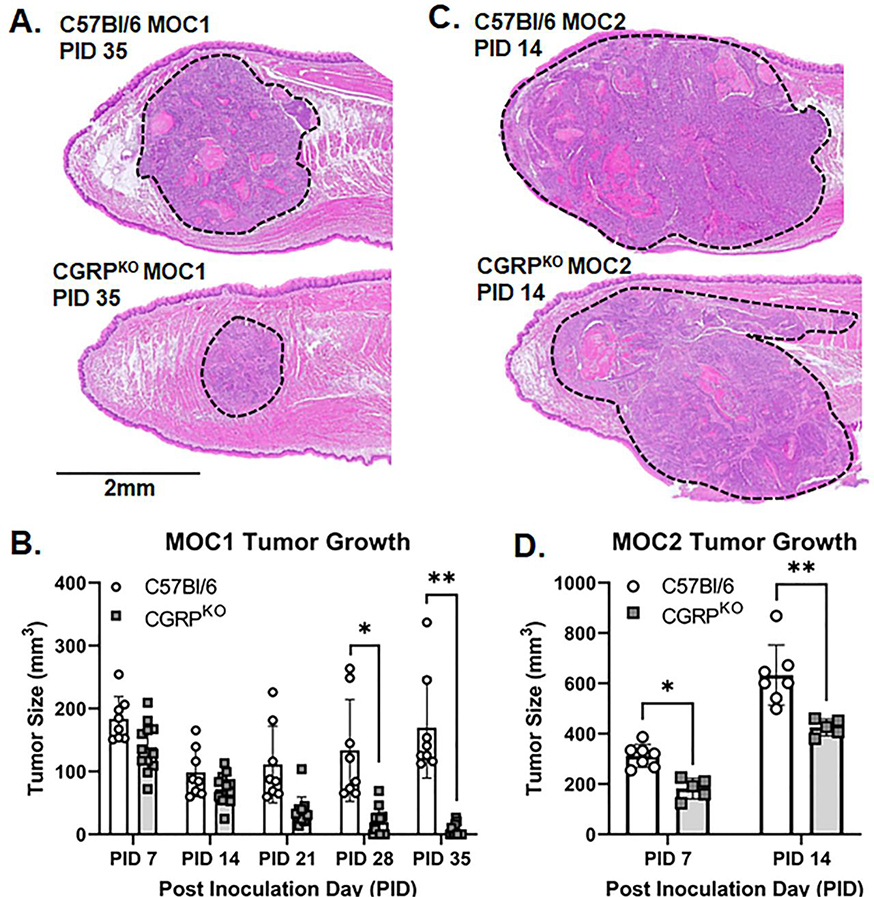
Figure 3. Loss of CGRP signaling slows tumor growth.
A) Representative images of MOC1 tumor size in wildtype mice (top) and CGRPKO mice (global Calca knockout, bottom) at PID 35. Images were collected from hematoxylin and eosin stained 5μm sections at 4x magnification. Tumors are outlined in black dotted lines. B) Quantitative analysis of tumor size measured by caliper over time in MOC1-tumor bearing mice (n=11 wildtype, n=8 CGRPKO). Tumor size was calculated using ellipsoid volume formula. Two-way ANOVA *p<0.05, **p<0.01. C) Representative images of MOC2 tumor size in wildtype mice (top) and CGRPKO mice (bottom) at PID 14. Images were collected from hematoxylin and eosin stained 5μm sections at 4x magnification. Tumors are outlined in black dotted lines. D) Quantitative analysis of tumor size measured by caliper over time in MOC2-tumor bearing mice (n=7 wildtype, n=5 CGRPKO). Tumor size was calculated using ellipsoid volume formula. Two-way ANOVA *p<0.05, **p<0.01.

