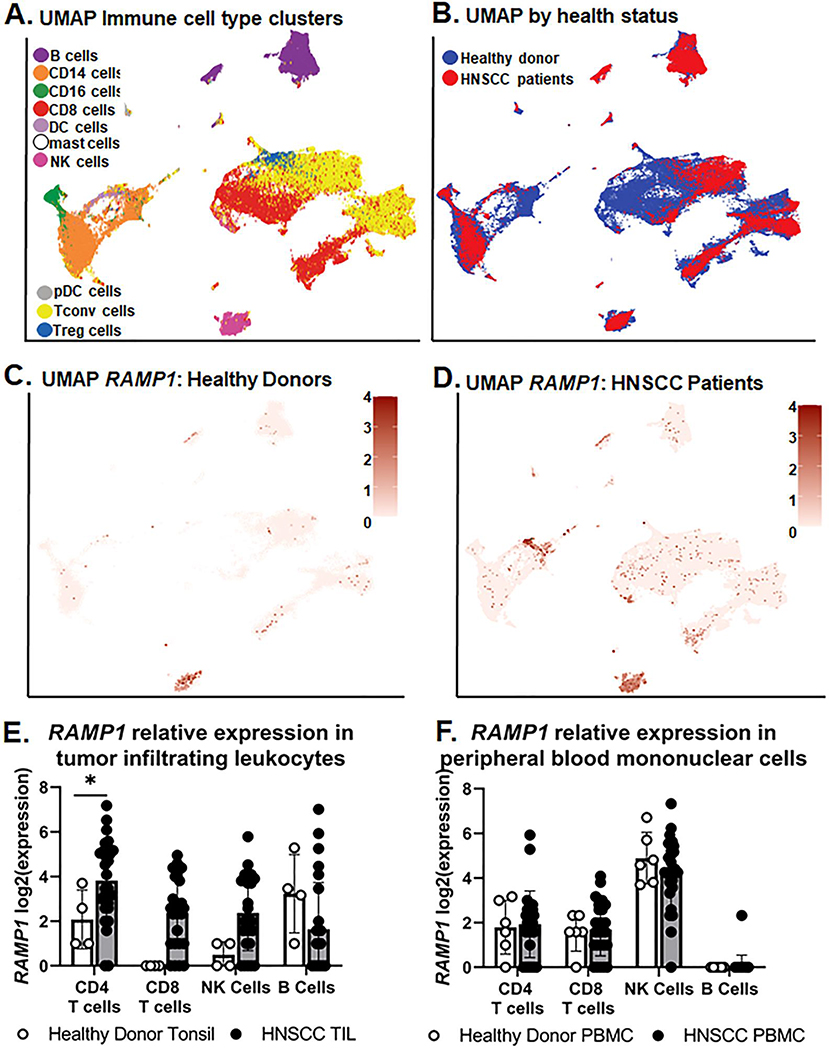
Figure 5. Assessment of RAMP1 gene expression in human immune cells by scRNAseq.
Publicly available scRNAseq data was leveraged to assess differential gene expression changes in RAMP1. Distinct UMAPS were generated by A) immune cell subtype and B) tissue health status. The same unique cluster embedding was used to show RAMP1 gene expression represented as a heat map in samples from (C) healthy donor and (D) HNSCC patients. Tonsil/Tumor and peripheral blood mononuclear cell (PBMC) samples were combined for these plots. Relative expression is represented as Log2(expression). Quantitative analysis of RAMP1 Log2(expression) in lymphocyte subsets using the Wald Test between (E) HNSCC tumor-infiltrating cells (TIL) and subsets isolated from health donor tonsil as well as (F) PBMCs from HNSCC and healthy donor PBMCs. *p<0.05.

