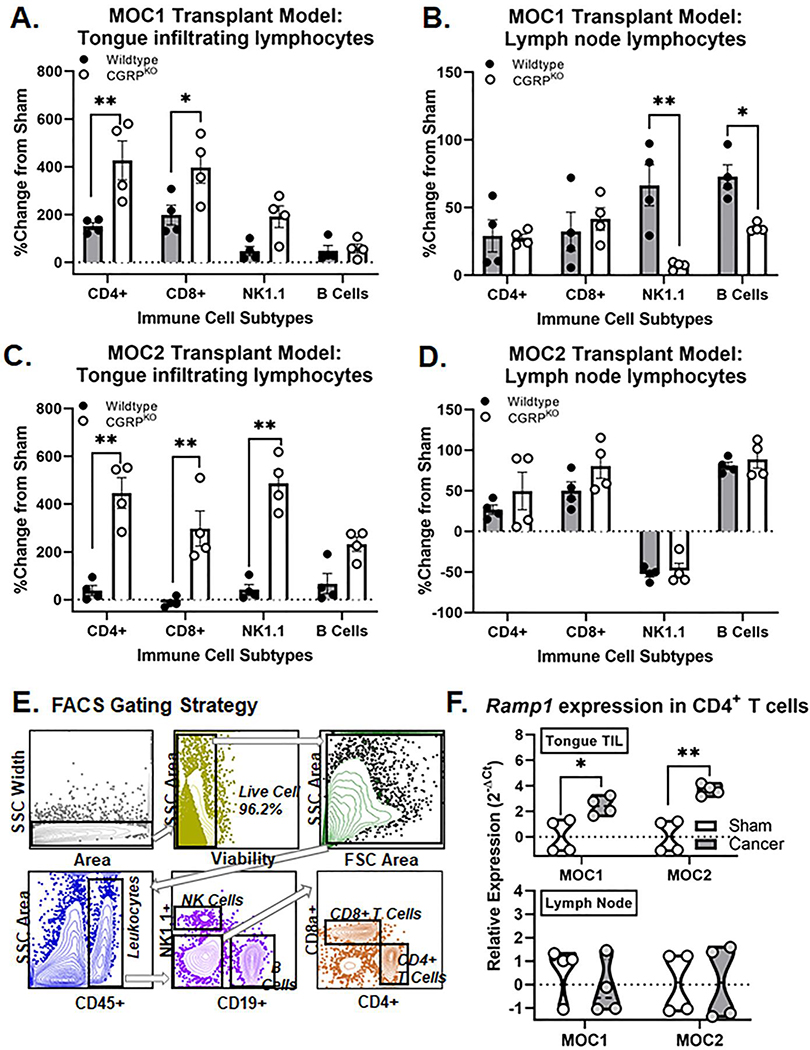
Figure 6. Increased immune cell infiltrate in CGRPKO mice.
Using flow cytometry, tumor infiltrating and lymph node lymphocyte subsets were quantified in dissociated tongue tissue from wildtype mice (black, n=4) and CGRPKO (white, n=4) from MOC1-tumor bearing mice at PID 21 (A,B) and MOC2-tumor bearing mice at PID 7 (C,D). Data are presented as a percent change from genotype-matched sham mice (n=4 per genotype). Two-way ANOVA, *p<0.05 **p<0.01. The percent of CD45+ immune cells quantified for both sham and tumor-bearing mice are available in Table 2. E) Representative gating strategy used to isolate tongue tumor infiltrating T cells by fluorescence-activated cell sorting (FACS). F) Quantification of Ramp1 expression in CD4+ T cells isolated from tongue or lymph node tissue from sham (white, n=4/time point), MOC1-tumor bearing mice (gray, n=4 PID 35), or MOC2-tumor bearing mice (gray, n=4, PID 14) relative to housekeeping gene Gapdh. Student’s t test *p<0.05, **p<0.01.

