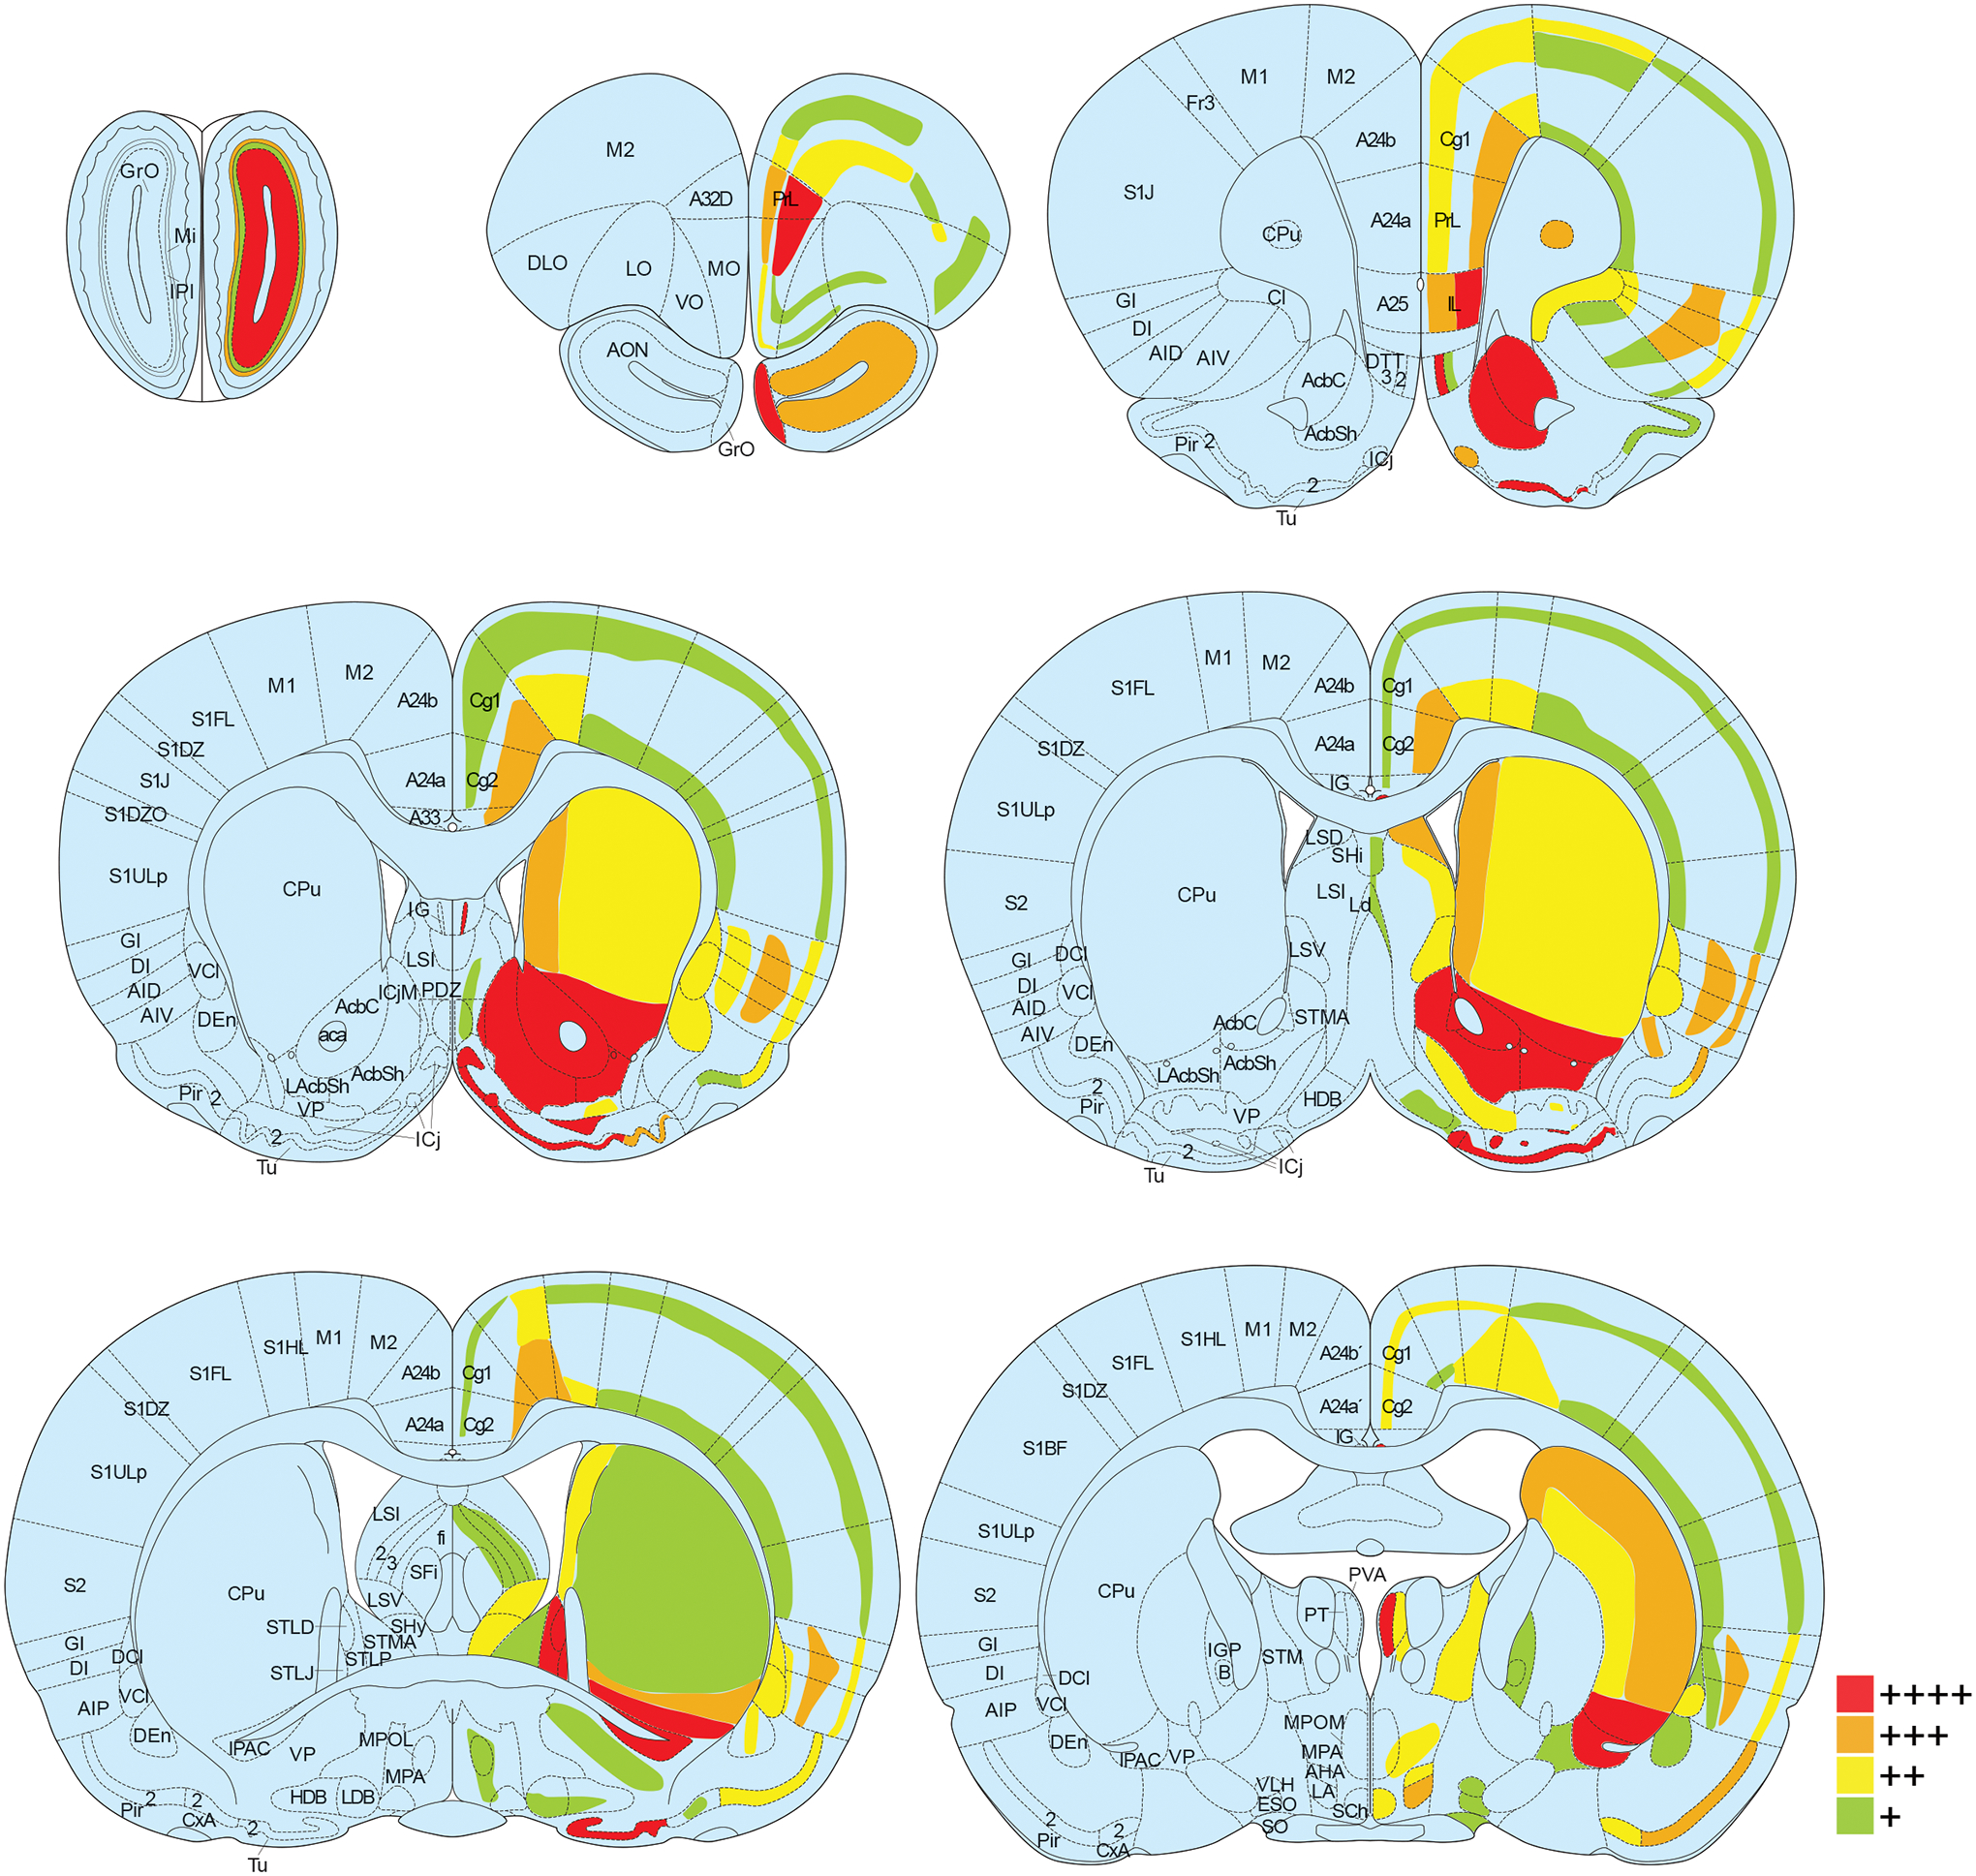
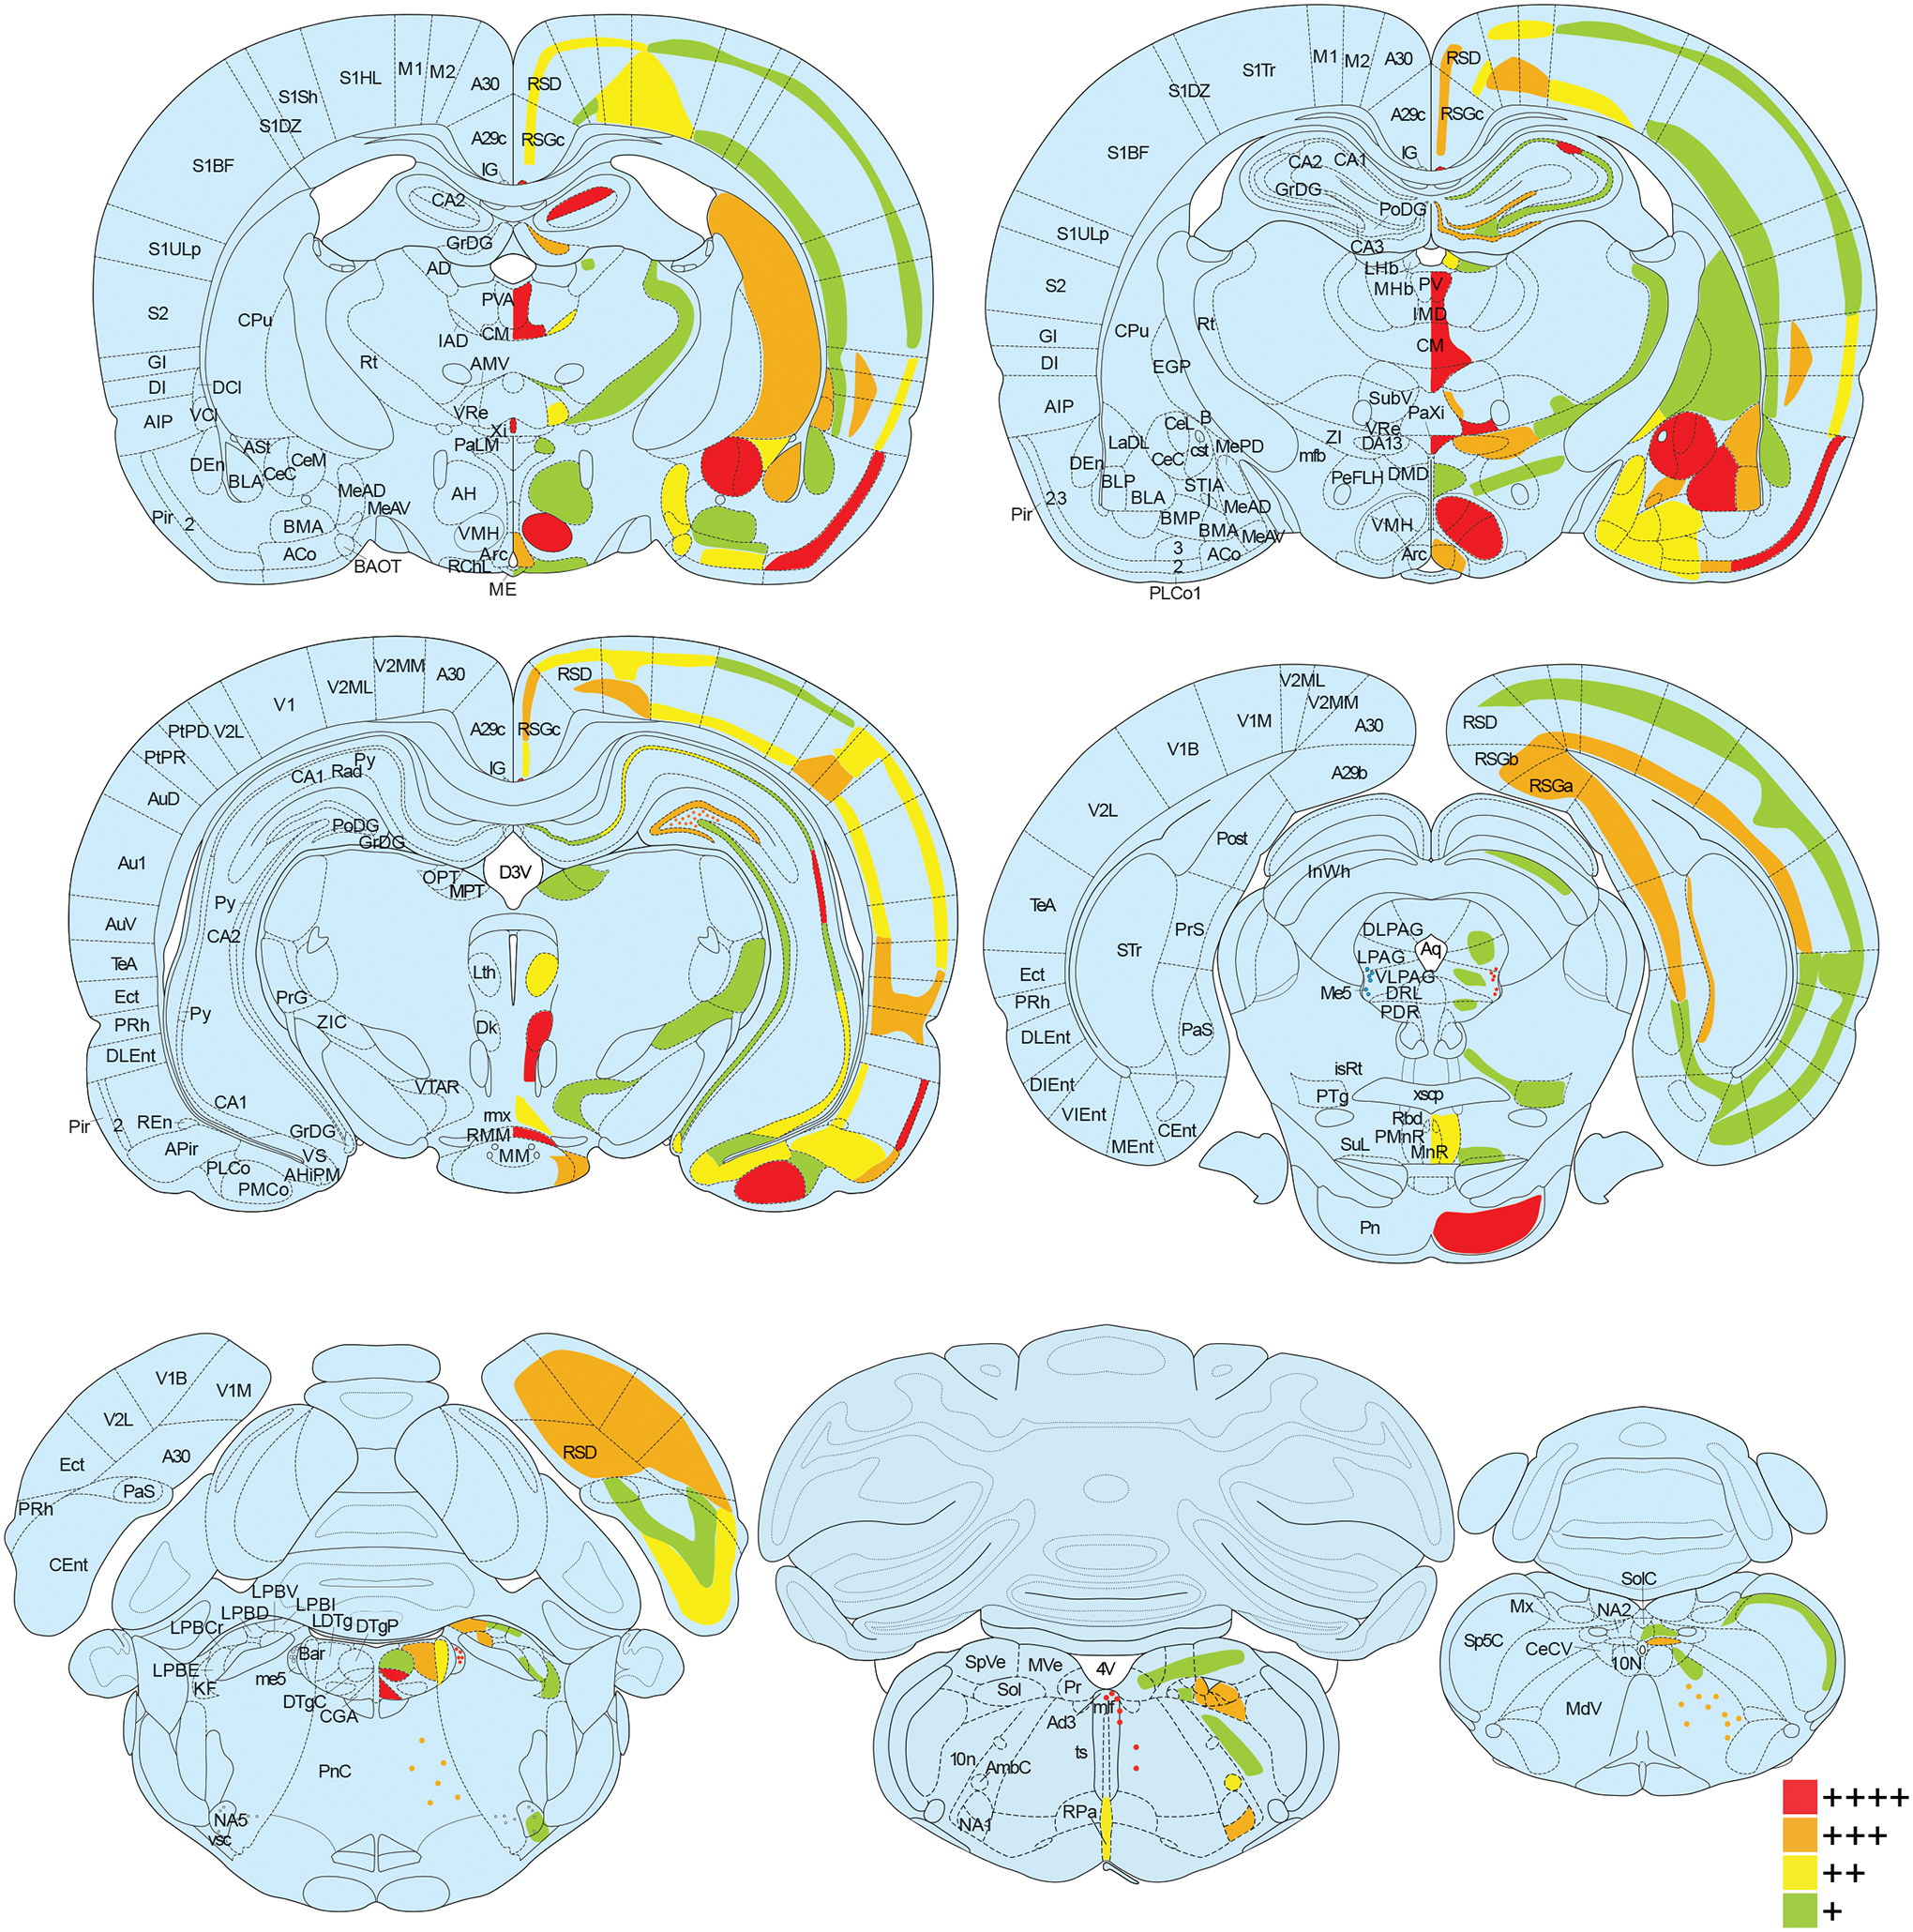
Figure 1. Oxtr mRNA expression throughout prairie vole brain.


Oxtr mRNA was labeled with in situ hybridization and the percent of cells positive for Oxtr was calculated for each brain region. Brain regions are color coded according to Oxtr expression density (green for 1–25% of cells expressing Oxtr, yellow for 26–50%, orange for 51–75%, and red for 76–100%) in coronal sections from a rat brain atlas at 14 points along the rostral-caudal axis (Paxinos, 2014). For some regions (i.e. reticular formation, molecular layer of the hippocampus) with sparse cells containing exceptionally strong expression, red dots were used. Abbreviations on the left half of the images correspond to new nomenclature used in the seventh edition of “The Rat Brain Atlas in Stereotaxic Coordinates” (Paxinos, 2014), while the abbreviations on the right half of the images correspond to traditional nomenclature used in previous editions. See Supplementary Table 1 for definitions of abbreviations.
