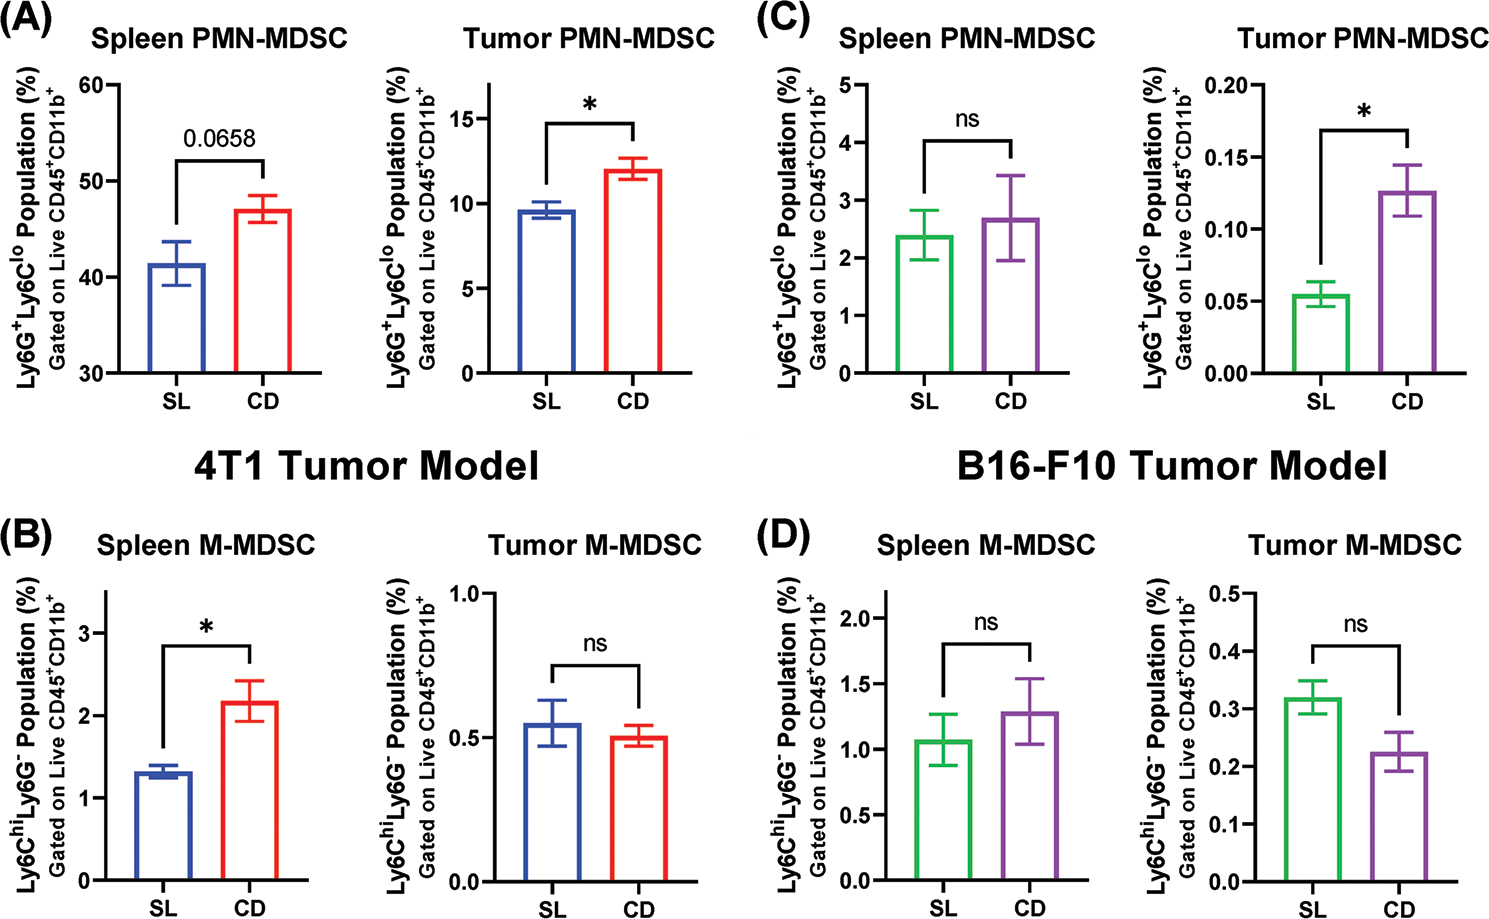
Figure 3.

Circadian disruption alters MDSCs accumulation in spleen and tumor. Flow cytometric analysis of MDSC subtypes in the spleen and tumor tissue of mice, as a proportion of the live cell population. A) PMN-MDSC populations in 4T1 tumor-bearing mice. B) M-MDSC populations in 4T1 tumor-bearing mice. C) PMN-MDSC populations in B16-F10 tumor-bearing mice D) M-MDSC populations in B16-F10 bearing mice. (n = 3–5) Data presented as mean ± SEM. A two-tailed unpaired Student’s t-test was used to analyze the statistical significance between the SL and CD groups. * = p < 0.05.
