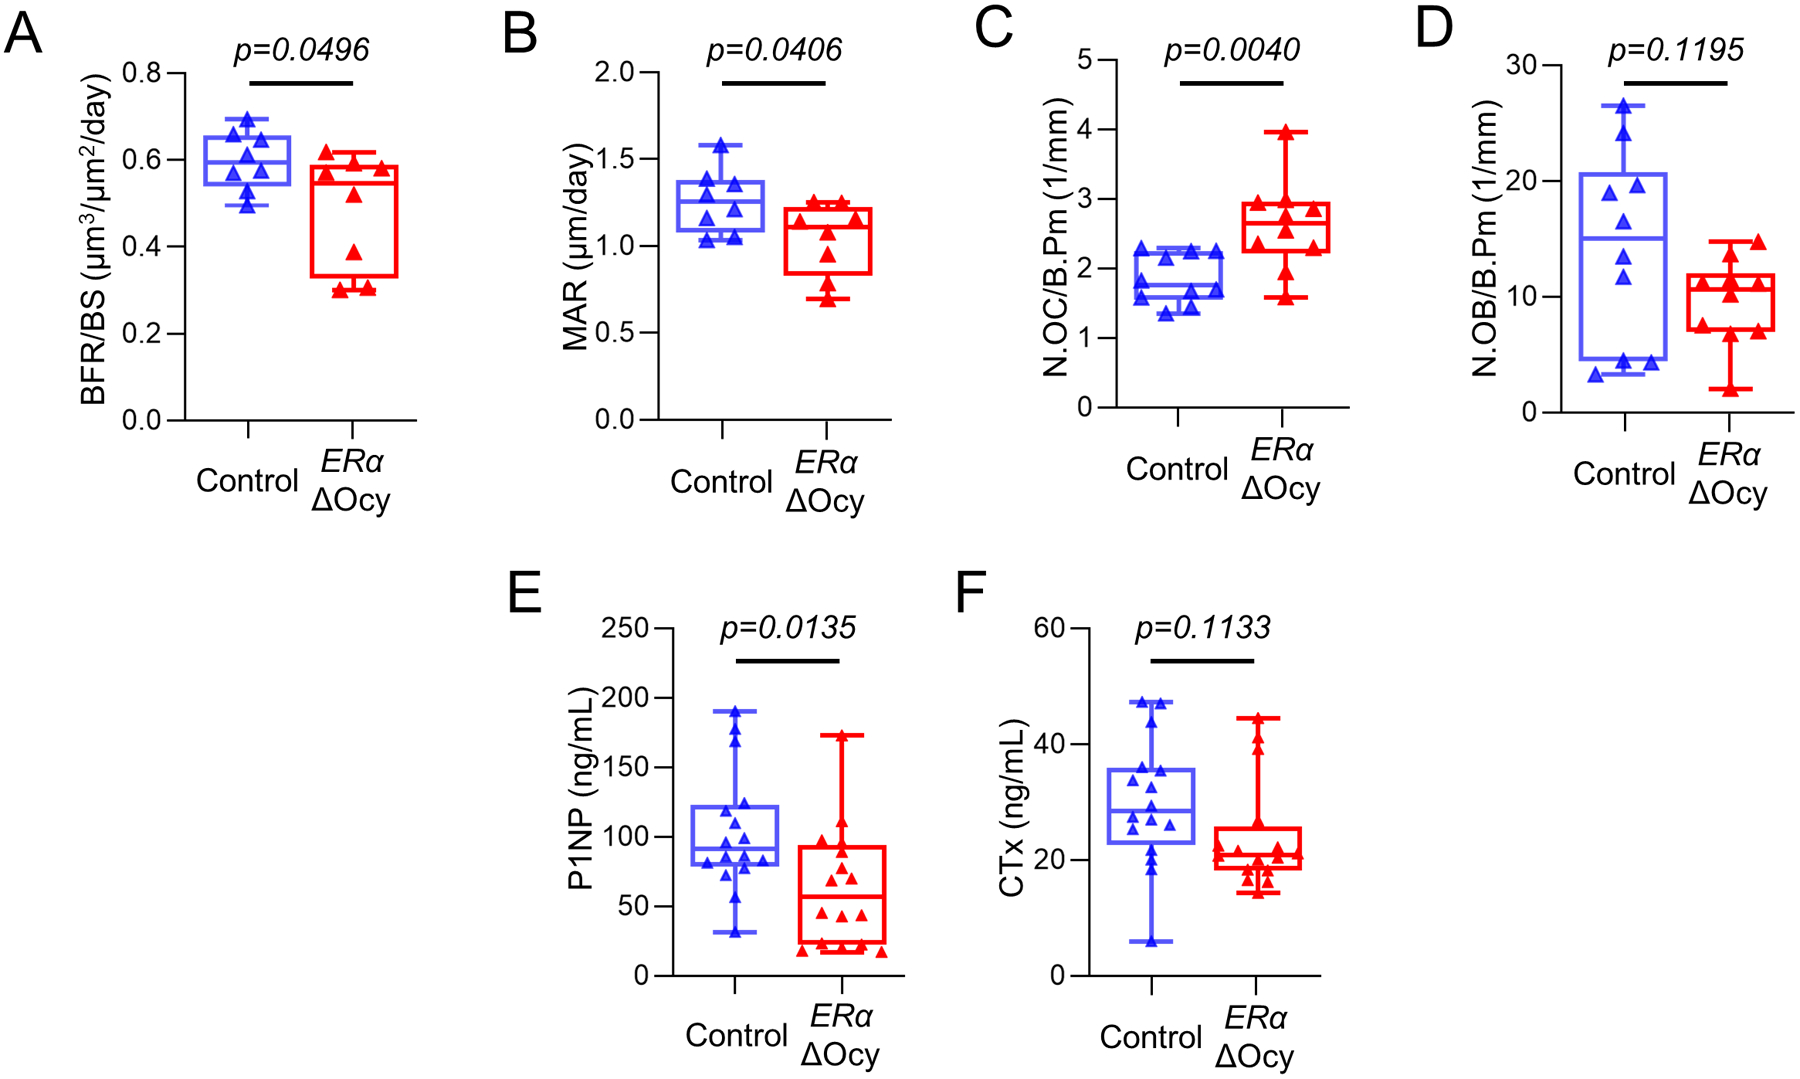
Figure 3.

ERα deletion in osteocytes leads to reduced bone formation and increased osteoclast numbers. (A) Measurement of bone formation rate per bone surface (BFR/BS) and (B) mineral apposition rates (MAR) in the lumbar spines of tamoxifen-treated Control or ERαΔOcy mice using double-label dynamic histomorphometry. (C) Counted number of osteoclasts (N.OC/B.Pm) and (D) osteoblasts (N.OB/B.Pm) normalized to bone perimeter using static histomorphometry. (E) PINP and (F) CTx levels measured from endpoint cardiac serum. n=8–16 per group. Boxes represent median and interquartile range and whiskers represent minimum and maximum values. Datasets analyzed by unpaired t-test.
