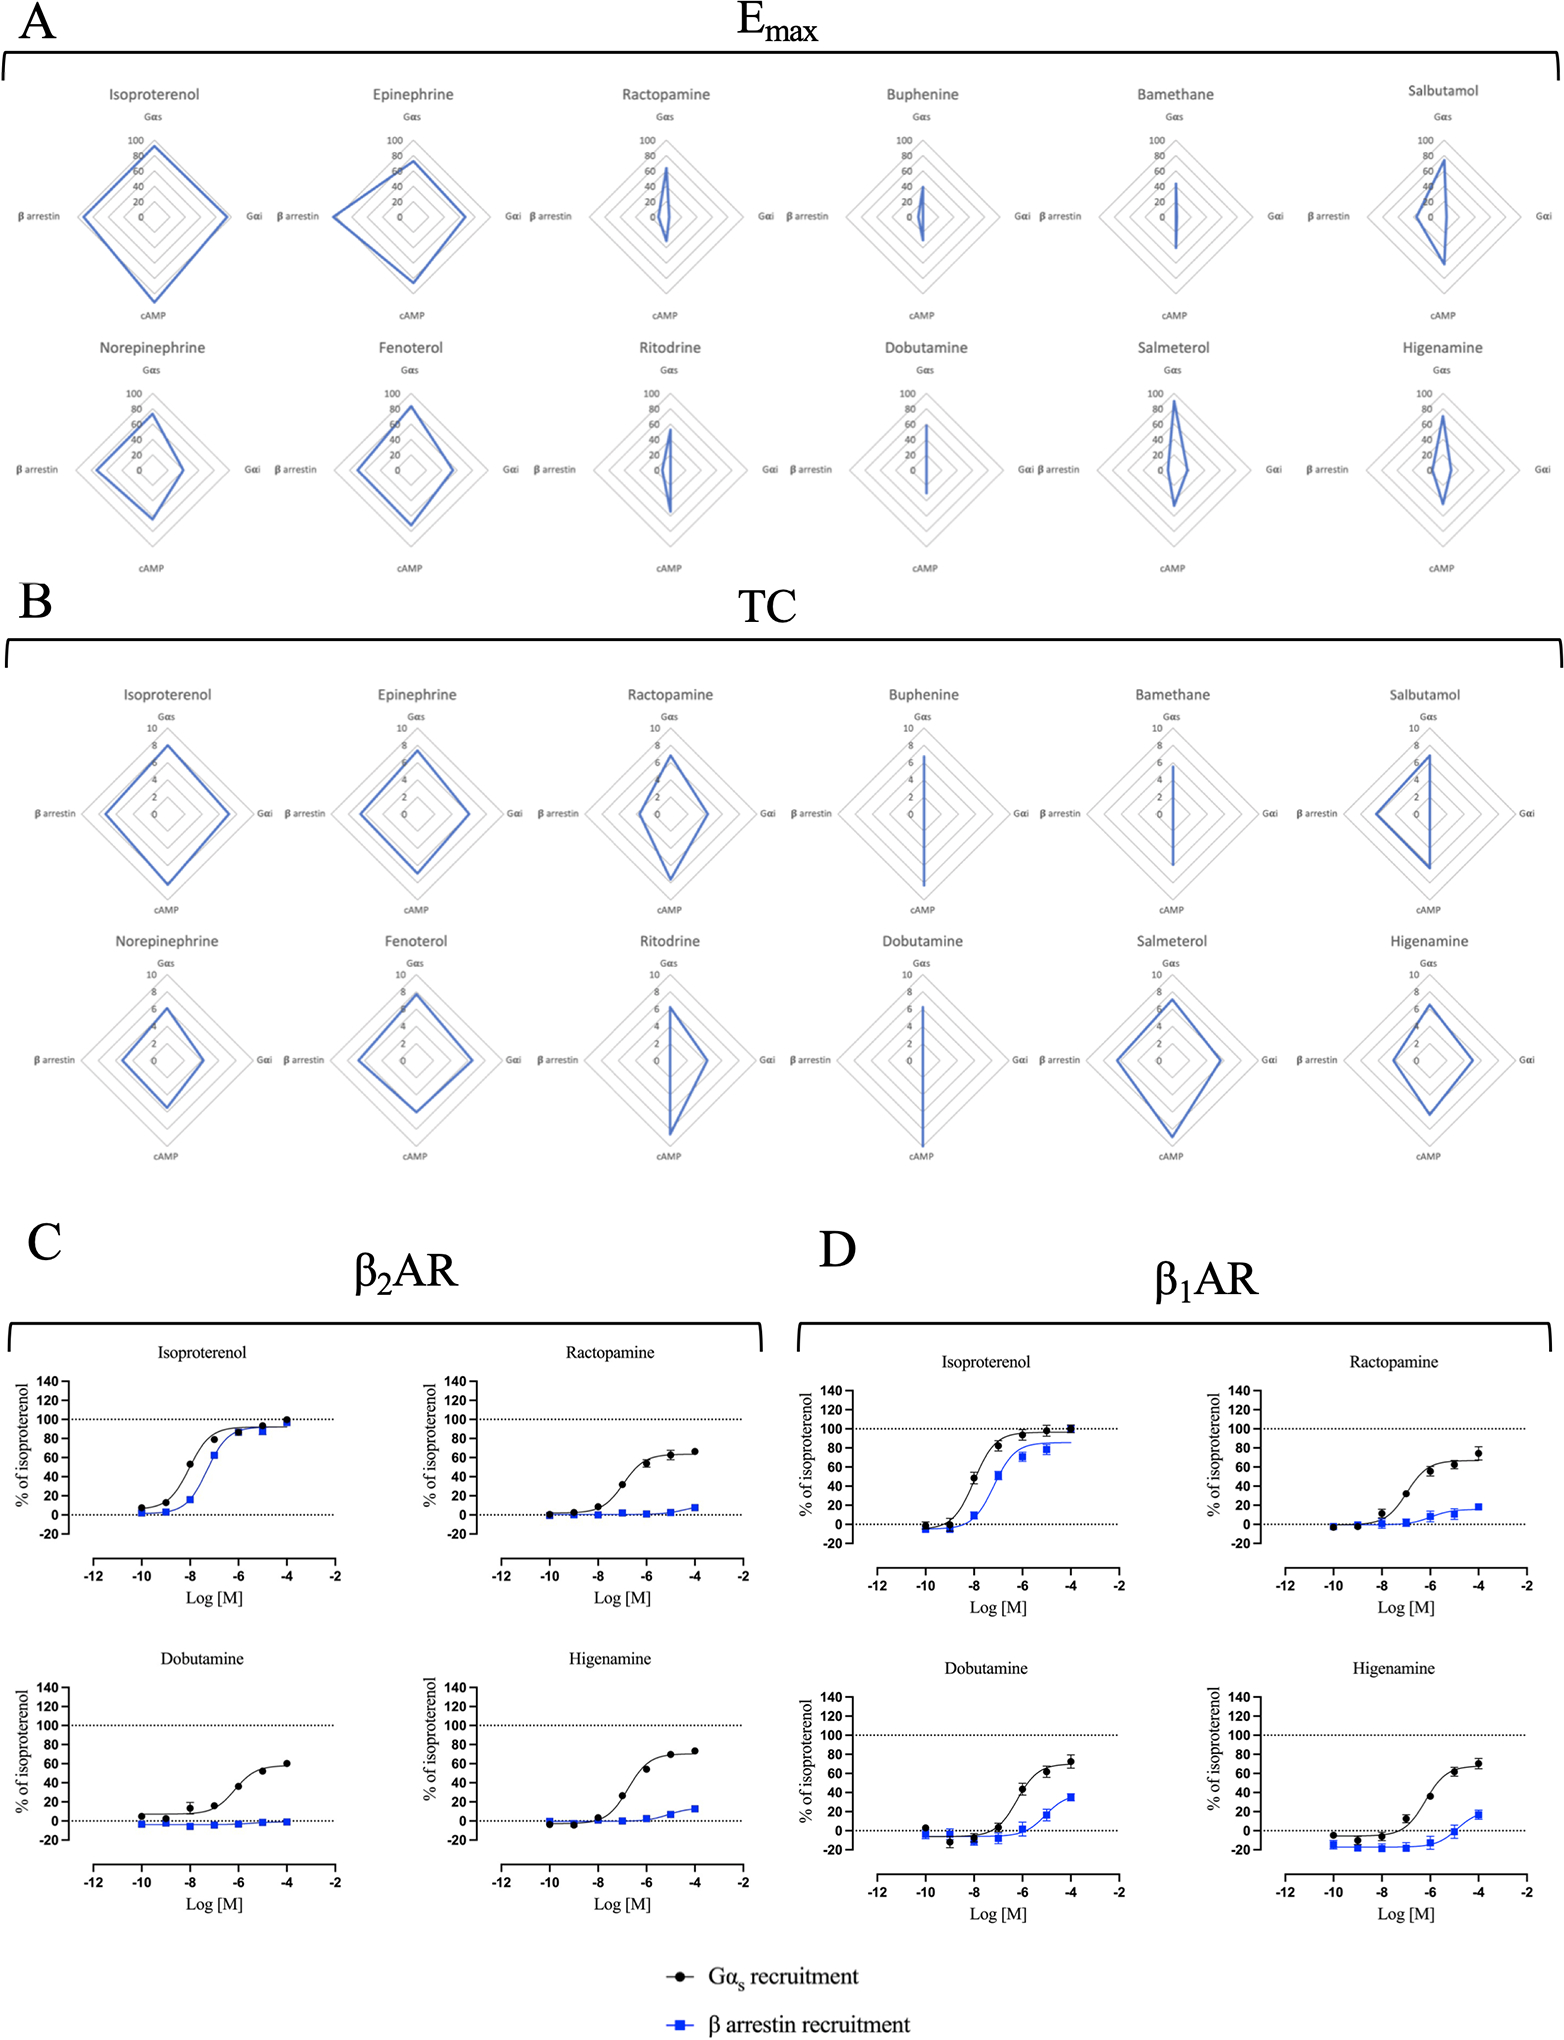
Figure 2 – Selection of the best Gs-biased candidates.

Multivariate analysis of (A) maximal efficacies (Emax) extrapolated from curve fitting of the concentration/activity curves from Fig. 1 and Table S1 and (B) transduction coefficients (TC) obtained after statistical fitting of the operational model of agonism to data extrapolated from Fig. 1, were represented in radial plots. Emax range is 0 – 100 while TC range is 0 – 10. Note that values that were very low and could not be accurately determined were given a value of zero in these plots. Direct comparison of concentration/activity curves for Gαs recruitment and β-arrestin recruitment induced by ISO, RAC, DOB and HIG at the β2AR (C) and the β1AR (D). Data for β2AR comparison were taken from Fig. 1A and B. For β1AR comparison, HEK293 cells were transiently transected with BRET donor β1AR-Rluc and BRET acceptor NES-venus-mGs or GFP-β-arrestin 2 depending on the read-out. After 48 h, cells were stimulated with increased concentration of ISO, RAC, DOB or HIG (10−10 to 10−4 M) for 20 min. Signal generated by each condition was plotted and fitted using the three parameters non-linear regression curve fitting in GraphPad Prism to generate concentration/activity curves. Signal was normalized to the average maximal response of ISO as 100%. Data are mean ± SEM, n = 6.
