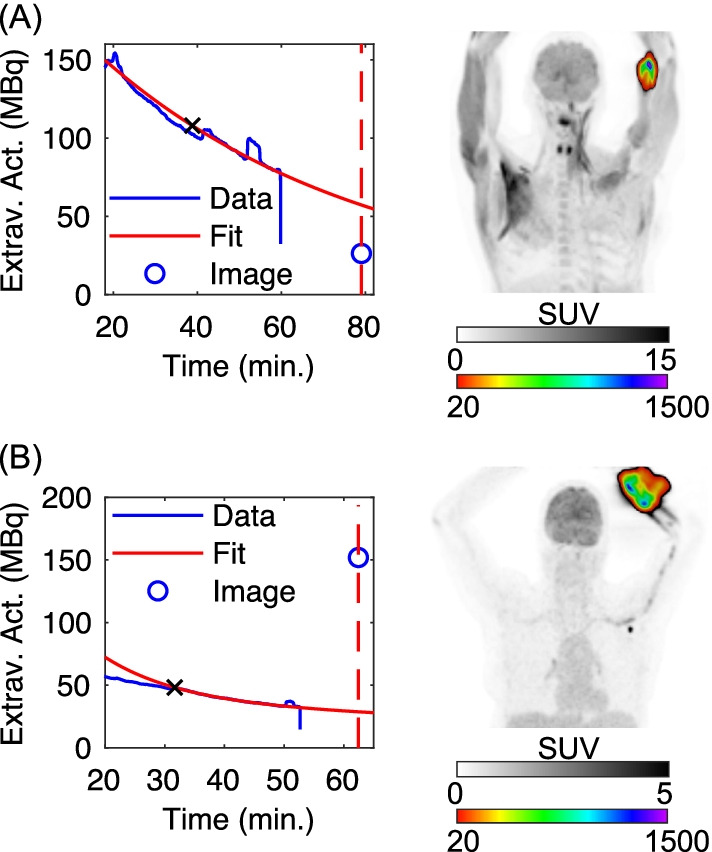
Fig. 6.

Topical detector TACs and PET images for two outliers in the leave-one-out analysis. Subjects with (A) left antecubital fossa ( = 26.3 MBq and = 4.1 kcps on Fig. 4A) and (B) left forearm ( = 152 MBq and = 3.2 kcps on Fig. 4A) injections, respectively. Topical detector TACs (“Data”) are scaled to total extravasation activity to produce , using the matched leave-one-out calibration factor. Extrapolation fits (“Fit”) (fit starts denoted by x’s) and ground truth PET extravasation activities, (“Image”), are also displayed. Coronal maximum intensity projections are shown in two color scales to better visualize distribution of tracer extravasations
