Fig. 2.
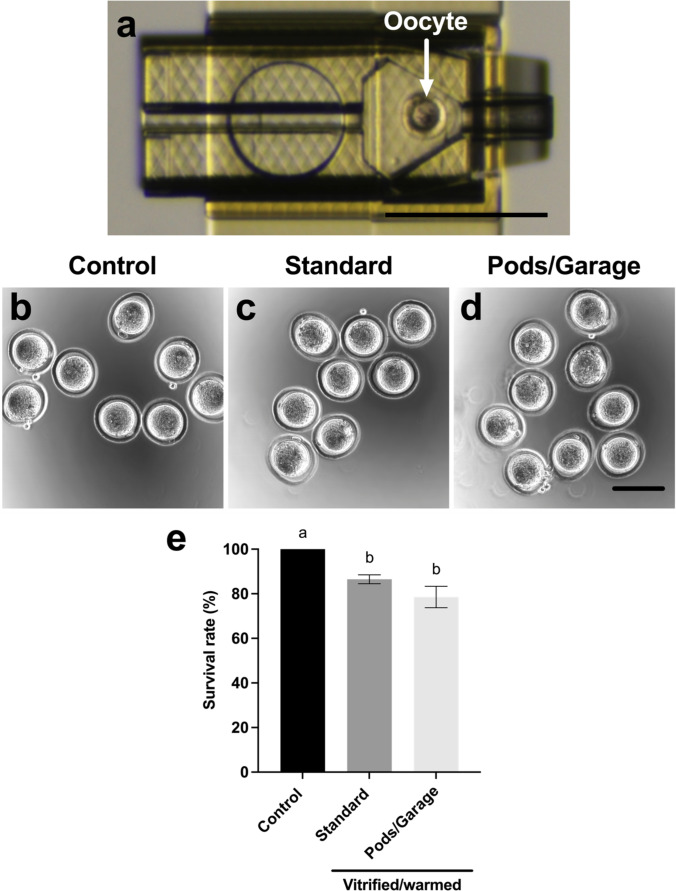
Oocytes vitrified within Pods and a Garage have a survival rate similar to those vitrified using standard practice. To assess the impact of vitrification and warming within our novel device, single oocytes were loaded into Pods (one oocyte per Pod) that were then docked into a Garage. An oocyte loaded into a single Pod docked in a Garage is shown in a. Oocytes were either not vitrified (Control; b) or vitrified and warmed using standard practice (Standard; c) or vitrified and warmed within Pods and a Garage (Pods/Garage; d). Oocyte survival rate was calculated for all groups following warming (e). Representative images were captured using a 10 × objective with a final magnification of 40 × (Nikon SMZ1500 microscope; Scale bar = 250 μm; a) or using a 10 × objective with a final magnification of 38 × (Olympus Fluoview 10i confocal microscope; Scale bar = 100 μm; b–d). Data in e is presented as mean ± SEM (n = 7 experimental replicates, representative of a total of 160–210 oocytes). Data were arcsine transformed prior to statistical testing and analyzed with a Kruskal–Wallis test, P < 0.05. Different superscripts denote statistical differences between groups

