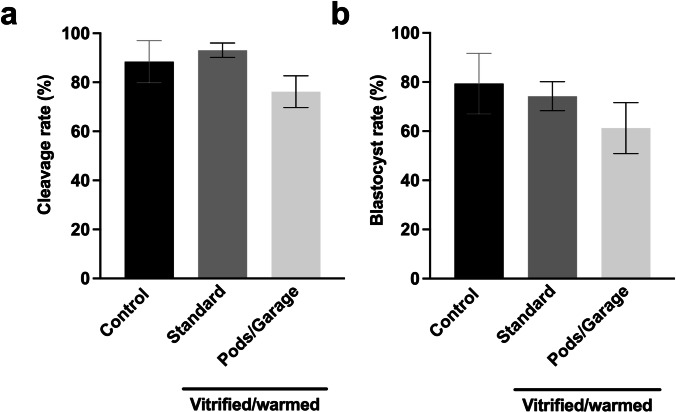
Fig. 4.
Fertilization and development to the blastocyst stage were similar between oocytes that underwent vitrification using standard practice and vitrification within Pods and a Garage. To demonstrate utility of the Pod and Garage system for oocyte vitrification, single oocytes were loaded into Pods (one oocyte per Pod) that were then docked into a Garage. Oocytes were either not vitrified (Control), vitrified, and warmed using standard practice (Standard), or vitrified and warmed within Pods and a Garage (Pods/Garage). Oocytes were then fertilized, and subsequent cleavage and blastocyst rates scored. Cleavage rate was calculated by the number of two-cell embryos from the starting number of fertilized oocytes (a). Blastocyst rate was calculated from the starting number of oocytes (b). All data are presented as mean ± SEM (n = 4 experimental replicates, representative of a total of 43–113 two-cell embryos and 34–101 blastocyst-stage embryos). Data were arcsine transformed prior to statistical testing and analyzed using a Kruskal–Wallis test, P > 0.05

