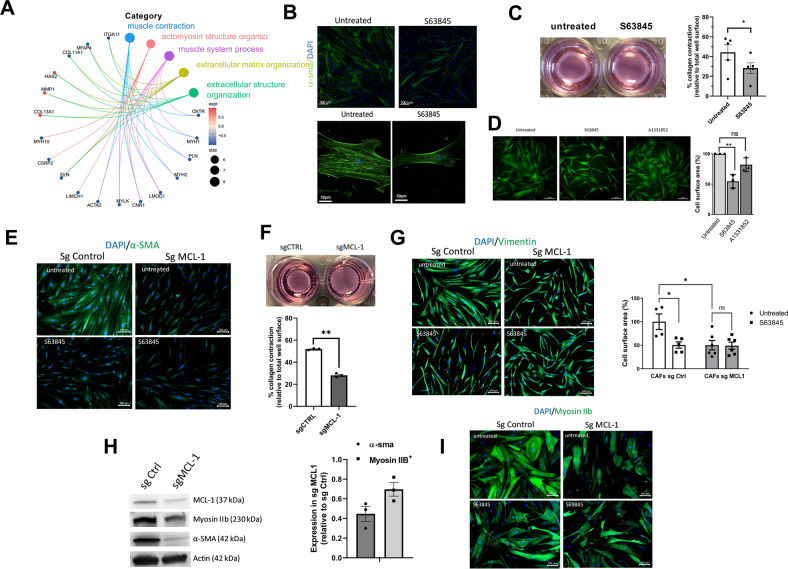
Fig. 2. MCL-1 antagonist mitigates myofibroblastic features.
A Gene Ontology (GO) pathway enrichment analysis based on DGE results. B Representative immunofluorescence of α-smooth muscle actin (α-SMA) (green) in CAF treated or not with S63845 for 18 h, nuclei were stained in blue (4’,6-diamidino-2-phenylindole, DAPI) (n = 3). C Representative images of CAFs contraction of collagen gels. Quantification of collagen gel contraction by CAFs treated or not with S63845. 100% represents the total surface area of the well (n = 5) Student t-test, *P < 0.05. D Representative immunocytochemistry of Vimentin immunostaining used to determine cells surface area of 3 different CAFs treated or not with S63845 500 nM or A1331852 100 nM for 18 h. Cells area were determined with imageJ software by measuring average of cell surface area from 200 cells for each condition, results are expressed in arbitrary unit relative to untreated cells. Anova, **P < 0.01, ns: not significant. E Representative immunofluorescence of α-smooth muscle actin (α-SMA) (green) in CAFs knock down for MCL-1 (Sg MCL-1) or not (Sg control), nuclei were stained in blue (4’,6-diamidino-2-phenylindole, DAPI) (n = 3). F Representative images of CAFs contraction of collagen gels. Quantification of collagen gel contraction by CAFs knock down for MCL-1 (Sg MCL-1) or not (Sg Control). 100% represents the total surface area of the well. (n = 3) Student t-test, **P < 0.01. G Representative immunocytochemistry of Vimentin immunostaining used to determine cells surface area of 3 different CAFs Sg Control or Sg MCL-1. Cells area were determined with imageJ software by measuring average of cell surface area from 200 cells for each condition, results are expressed in arbitrary unit relative to untreated cells. Anova, *P < 0.05, ns: not significant. H (Left) Representative experiment of protein expression level (MCL-1, Myosin IIB, α-SMA) evaluated using western blots, Actin expression was used as loading control. (Right) Quantification of the amounts of α-SMA or Myosin IIB protein band relative to Actin in CAFs Sg MCL-1, results are expressed as a ratio relative to Sg Control. I Representative immunofluorescence of Myosin IIB (green) in CAFs knock down for MCL-1 (Sg MCL-1) or not (Sg control), nuclei were stained in blue (4’,6-diamidino-2-phenylindole, DAPI) (n = 3).

