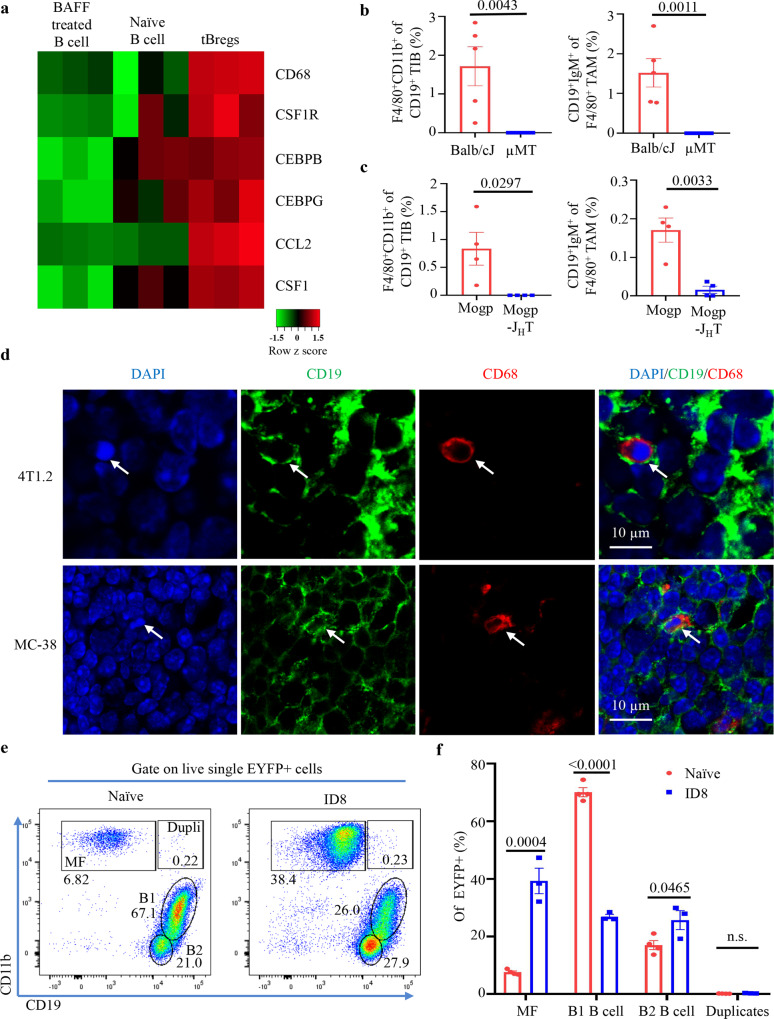
Fig. 1. B-cell and macrophage marker co-expressing cells present in the TIB and TAM from cancer microenvironment.
a mRNA microarray heatmap showing macrophage-specific gene expression in tBregs as compared with naïve or BAFF-treated B cells from spleen (n = 3 mice). Scale bar is for expression z-score. b, c FACS staining frequency (Mean ± SEM) of expression of macrophage (MF, F4/80+CD11b+) and B-cell (CD19+IgM+) surface markers in, respectively, TIB and TAM from the primary tumors of BALB/CJ and µMT mice with orthotopic 4T1.2 breast cancer (n = 5 for BALB/CJ, n = 6 for µMT b), and in the peritoneum of C57BL/6 and JHT mice with Mogp cancer (Mogp and Mogp-JHT, respectively, n = 4, c). P-values in b (P = 0.0043 and P = 0.0011 are for indicated cells in BALB/CJ vs µMT) and c (P = 0.0297, P = 0.0033 are for indicated cells in Mogp vs Mogp-JHT) were calculated using two-tailed unpaired t-test. Gating strategy is shown in Supplementary Fig. 1a. d Representative immunohistochemistry staining of primary tumors from BALB/c and C57BL/6 mice with 4T1.2 breast cancer (upper panel) and MC38 colon cancer (lower panel) detects CD19+CD68+ cells withing B cells (CD19+) and myeloid phagocytes (CD68+, n = 3 mice per group). Scale bar is for 10 μm. e, f ID8 cancer-bearing MB1-EYFP mice significantly increase MB1-EYFP+ cells in the peritoneum with ID8 cancer as compared to that of naïve EYFP mice. Representative FACS plot and Mean frequency ± SEM (n = 3 mice) of MF, B1 B cells (B1) and B2 B cells withing EYFP cells are shown in e and f, respectively. P-values in f were calculated using two-tailed unpaired t-test (MF P = 0.0004; B1 B cell P < 0.0001; B2 B cell P = 0.0465 Naïve vs ID8). Consistent with marked loss of CD19 in B-MF, only negligible frequency of CD19+F4/80+CD11b+EYFP+ cells (Dupli or duplicates) are detected in both naïve and ID8 cancer-bearing mice. Results in b, c, and e were independently reproduced at least three times. From here on, Error bars are for SEM.

