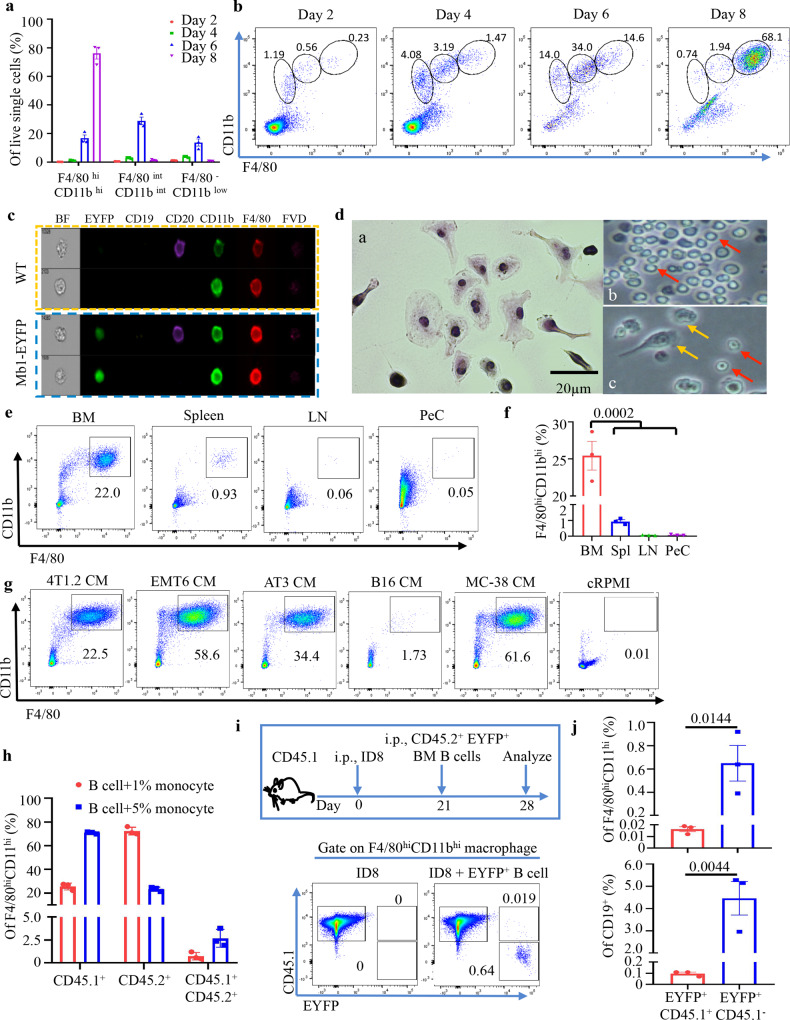
Fig. 2. Cancer induces differentiation of macrophages from BM B cells.
a, b 4T1.2-CM cause transdifferentiation of BM B cells. Mean frequency ± SEM of FACS staining (a n = 3 mice; and b representative FACS plots) to show gradual upregulation of macrophage markers in indicated gates (circles, b) after culture in 4T1.2-CM. Representative Imagestream (c) and Giemsa staining (d) images of in vitro-generated B-MF from naïve WT (c, d) and Mb-EYFP+ mice (bottom panel, c) showing co-expression of B-cell and MF markers (c), larger size and adherence to plastic (d). Red and Yellow arrows are for nonadherent B cells and adherent B-MF, respectively (bright light images, d). Scale bar is of 20 μm. e, f B-MF are generated from BM B cells. Representative FACS plot (e) and quantification (Mean frequency ± SEM, f, n = 3 mice, P = 0.0002 BM vs spleen, LN and PeC) of F4/80hiCD11bhi B-MF converted from BM, spleen, inguinal LN, and PeC B cells of naïve BALB/c mice as in e. g Unlike control CM (B16-F10 cells or cRPMI), CM of indicated cancer cells induce the generation of B-MF from BM B cells. Numbers are for % of gated cells (B-MF, see Supplementary Fig. 3h for quantification results). h–j The B-MF generation is not a result of trogocytosis. h Frequency of CD45 isoforms from in vitro differentiation of BM CD45.2+ (EYFP+) B cells mixed with CD45.1+ monocytes (1% and 5%). Y-axis is for Mean frequency ± SEM of EYFP+/CD45.2+ and EYFP−/CD45.1+ cells within F4/80+CD11b+ cells, respectively (n = 3 mice, gating strategy in Supplementary Fig. 4a, b). i Schema of in vivo conversion of CD45.2+ (EYFP+) B cells in PeC of CD45.1+ mice with 21-day peritoneal ID8 tumor, and representative FACS plot (gaiting strategy is in Supplementary Fig. 4C). j Quantification of CD45.2 and CD45.1-expressing CD19+ (P = 0.0044) and F4/80+CD11b+ (P = 0.0144) cells (Mean frequency ± SEM, n = 3 mice). P-values in f and j were calculated using two-tailed unpaired t-test. Results were independently confirmed at least three times (a/b, e/f, and g) and twice (c, d, h, and j).

