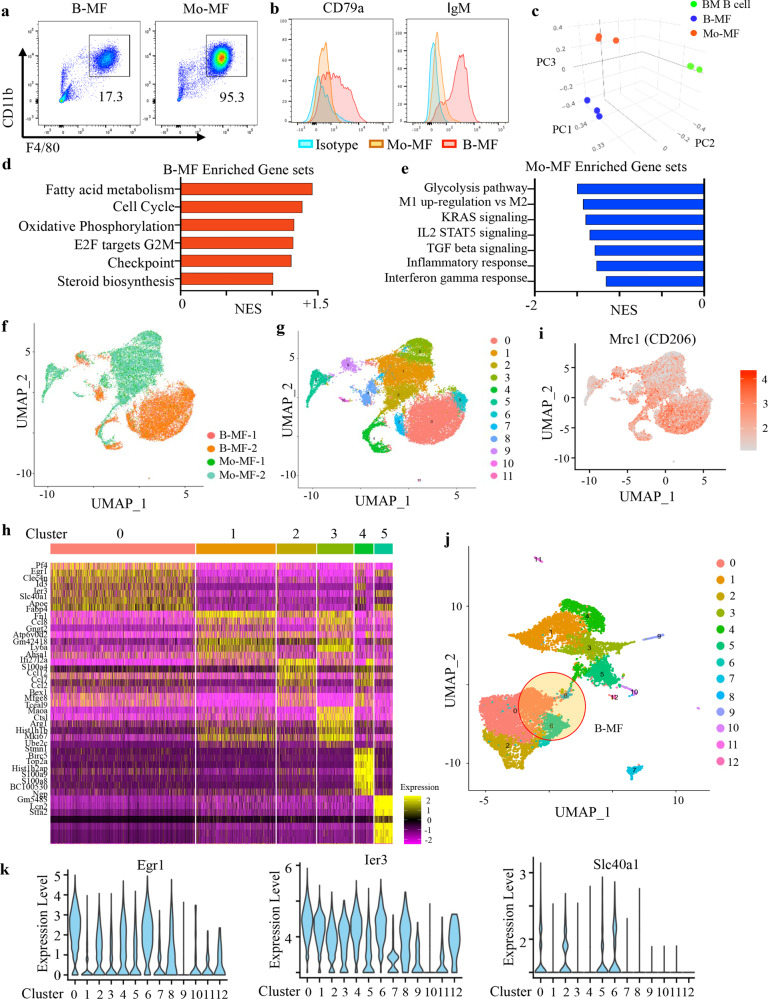
Fig. 3. Distinct gene expression profiles of B-MF and Mo-MF.
a, b Representative FACS plots (a) and histograms (b) of BM-MF and Mo-MF generated from BM B cells or monocytes after 7-day treatment with 4T1.2-CM. Numbers are for proportion of gated (F4/80hiCD11bhi) cells (a). b Shows expression of CD79a and IgM in B-MF (Red) and Mo-MF (Orange). c PCA plot of mRNA expression profiles generated from microarray data of sort-purified B-MF (Blue), Mo-MF (Orange) and BM B cells (Green) (n = 3 mice). d, e Bar plots of GSEA predicted pathways enriched in B-MF (d) or Mo-MF cells (e) from the Molecular Signature Database. f, g UMAP plots of scRNA sequencing (scRNA-seq) of B-MFs (10,563 cells) and Mo-MFs (10,235 cells) analyzed using Seurat with colors depicting clusters by cell type (f) or by gene expression (g). h Heatmap of top differentially expressed genes (DEG) in 6 major clusters of in vitro-generated B-MF and Mo-MF. i Mrc1 expression in B-MF and Mo-MF single cells shown in f. j scRNA-seq UMAP plot of FACS-purified TAM (10,885 cells) from 4 mice with 4T1.2 cancer cells shows 13 unique cell clusters. Three clusters with overlapping signatures with B-MF are highlighted. k Violin plots of three DEG (Egr1, Ier3 and Slc40a1) upregulated in B-MF in vitro and in TAM from mice with 4T1.2 cancer.

