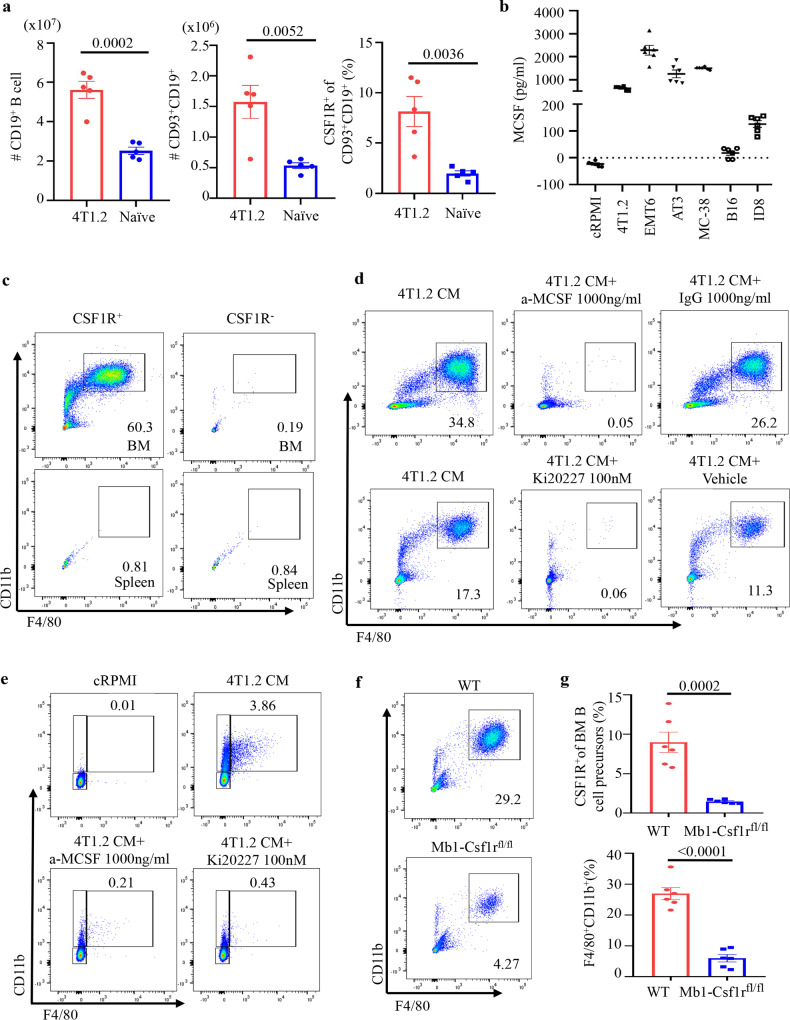
Fig. 5. Cancer mobilizes CSF1R+ BMBP into the circulation to generate B-MF via signaling CSF1/CSF1R axis.
a Numbers ± SEM of CD19+ (P = 0.0002, left) and CD93+CD19+ (P = 0.0052, middle) B cells and frequency ± SEM of CSF1R+ within CD93+CD19+ B cells in the spleen of naïve vs 4T1.2 cancer-bearing BALB/c mice (P = 0.0036, right, n = 5). b ELISA measurements of secreted M-CSF in CM by 4T1.2, EMT6, AT3, MC38, B16-F10, and ID8 cells (n = 6, pg/ml). c–e Representative FACS plots of the F4/80+CD11b+ B-MF converted from highly FACS-purified BM CSF1R+ and CSF1R− B-cell precursors and splenic CSF1R+ and CSF1R− B cells (c), BMBP after 7-day (d), or pre-B-cell line 70z/3 after 30-day (e) culture in 4T1.2-CM alone or in the presence of neutralizing anti-M-CSF Ab or a specific CSF1R inhibitor Ki20227 (d, e). f, g Representative FACS plot (f) and quantification (frequency ± SEM, g) of CSF1R+ BM B cells in Mb1-CSF1RFlox/Flox mice as compared to WT littermates (P = 0.0002, top panel) used for the generation of B-MF after 7-day 4T1.2-CM treatment (P < 0.0001, lower panel, n = 6 mice). Gating is shown in Supplementary Fig. 8. In a, b, and g, each symbol is for a single mouse. P-values in a, b, and g were calculated using two-tailed unpaired t-test. Results for all panels were independently reproduced at least three times.

