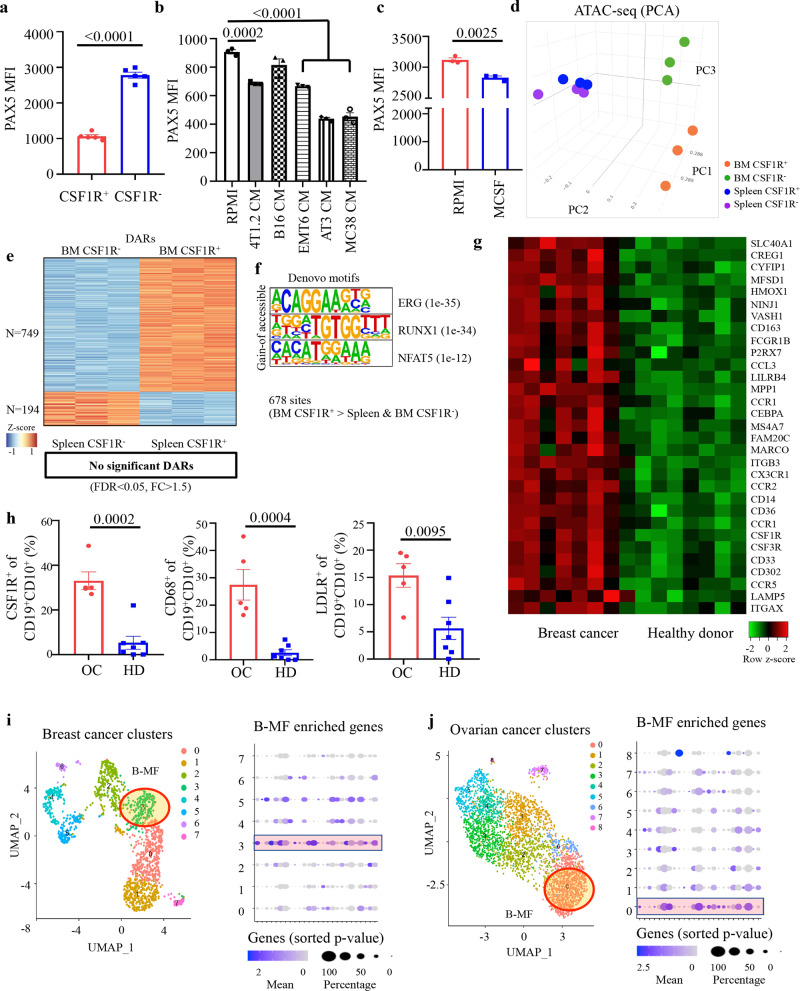
Fig. 6. Cancer targets BM CSF1R+PAX5Low B-cell precursors.
a–c Pax5 MFI (Mean ± SEM) in freshly isolated BM CSF1R− vs CSF1R+ B-cell precursors (P < 0.0001, n = 5 mice, a); in pre-B 70z/3 cells treated with indicated cancer CM (P = 0.0002 RPMI vs 4T1.2-CM, P < 0.0001 RPMI vs EMT6 CM, AT3 CM and MC38 CM, n = 3 independent cell cultures, b); and BM Lin− CSF1R+ CD19+B220+CD93+IgM−IgD− B-cell precursors after treatmentRPMI vs M-CSF for 48 h (P = 0.0025, n = 3, c). P-values in a–c were calculated using two-tailed unpaired t-test. d 3D PCA plot of chromatin accessibility data of BMBP CSF1R+ and CSF1R− from BM and spleen of naïve mice (n = 3 per group). e Heatmap of differentially accessible regions (DARs) in BM CSF1R+ and CSF1R− BMBP. No significant DARs with FDR < 0.05 and FC (fold change) >1.5 were detected in splenic cells. f Significant de novo motifs predicted from 678 sites that are more open in BM CSF1R+ compared to both BM and splenic CSF1R− BMBP. g mRNA microarray heatmap of macrophage-related DEGs in B cells isolated from PB of patients with breast cancer (BC, n = 8) compared to healthy donors (HD, n = 7). Scale bar is for expression z-score. h Frequency ± SEM of CSF1R+ (P = 0.0002, left), CD68+ (P = 0.0004, middle), and LDLR+ (P = 0.0095, right) cells within CD19+CD10+ B cells from PB of patients with ovarian cancer (OC) vs healthy donors (HD) (n = 5 for OC, n = 7 for HD). P-values in h were calculated using two-tailed unpaired t-test. i, j UMAP of scRNA-seq data of macrophages (left) and expression levels of the in vitro-generated B-MF genes (right) in published human BC (i) and OC (j) datasets. Highlighted regions show clusters with overlapping expression signatures of B-MF.

