FIGURE 5.

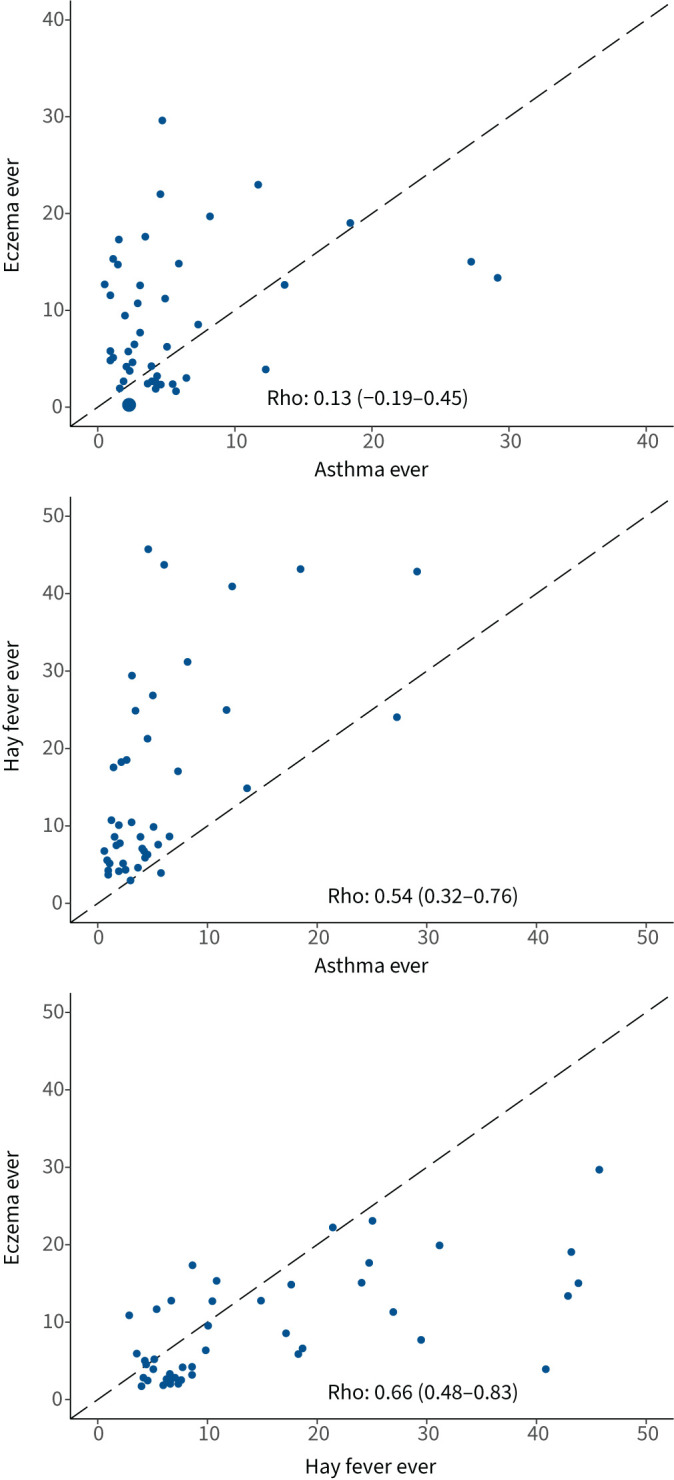
Rank correlation values and scatter plots of prevalence of the three conditions at the centre level. The dashed line is the identity line. Rank correlation coefficient (Rho) and 95% CI are shown in each graph.

Rank correlation values and scatter plots of prevalence of the three conditions at the centre level. The dashed line is the identity line. Rank correlation coefficient (Rho) and 95% CI are shown in each graph.