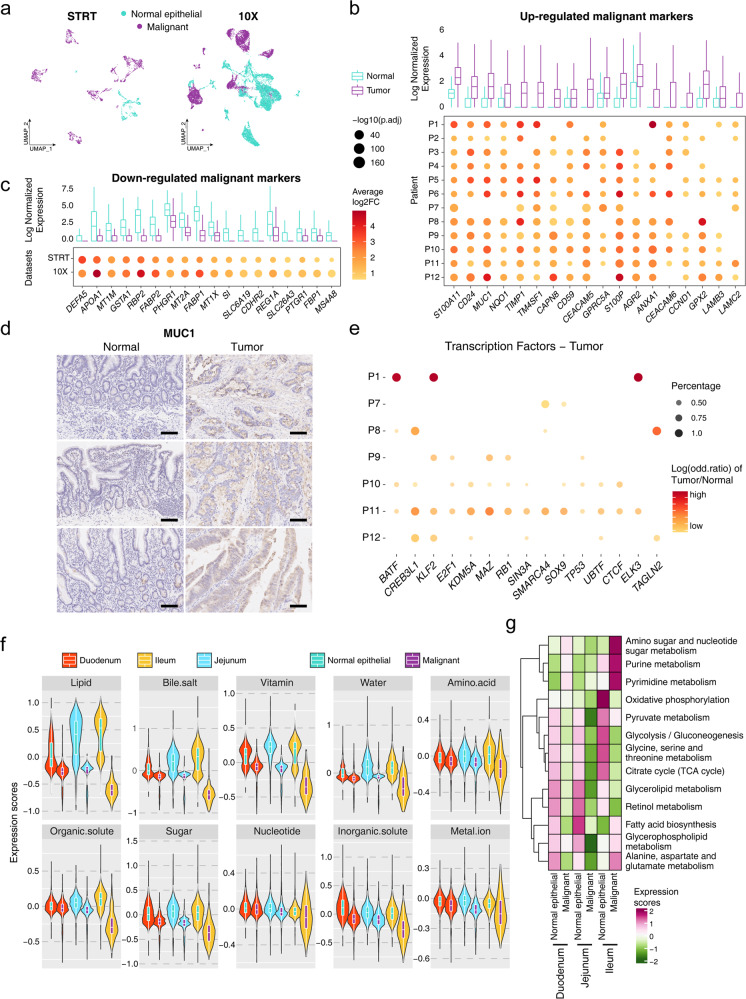
Fig. 2. Molecular signatures of the malignant cells and association with pathological characteristics in SBA.
a UMAP plot exhibiting the cell identification by CNV values in the STRT and 10× datasets. b, c Boxplots in the upper panel showing average normalized expression of the malignant cells and normal epithelial cells. Dot plots in the lower panel showing the log2 fold change (FC) of malignant cell relative to normal epithelial cell of each patient or dataset. d Representative IHC staining of MUC1 in adjacent normal and primary tumor tissues (original magnification 100×). The rows of the paired normal and tumor samples are from the same patients, and three individual patients are listed. Scale bar, 100 μm. e Dot plot showing the log odd ratio values of tumor/normal of corresponding TFs, with P values calculated by χ2 test. f Violin plot showing the expression scores of absorptive and transport gene sets in malignant and normal epithelial cells from different intestinal regions. g Heatmap showing the expression scores of metabolism pathways in malignant and normal epithelial cells from different intestinal regions.

