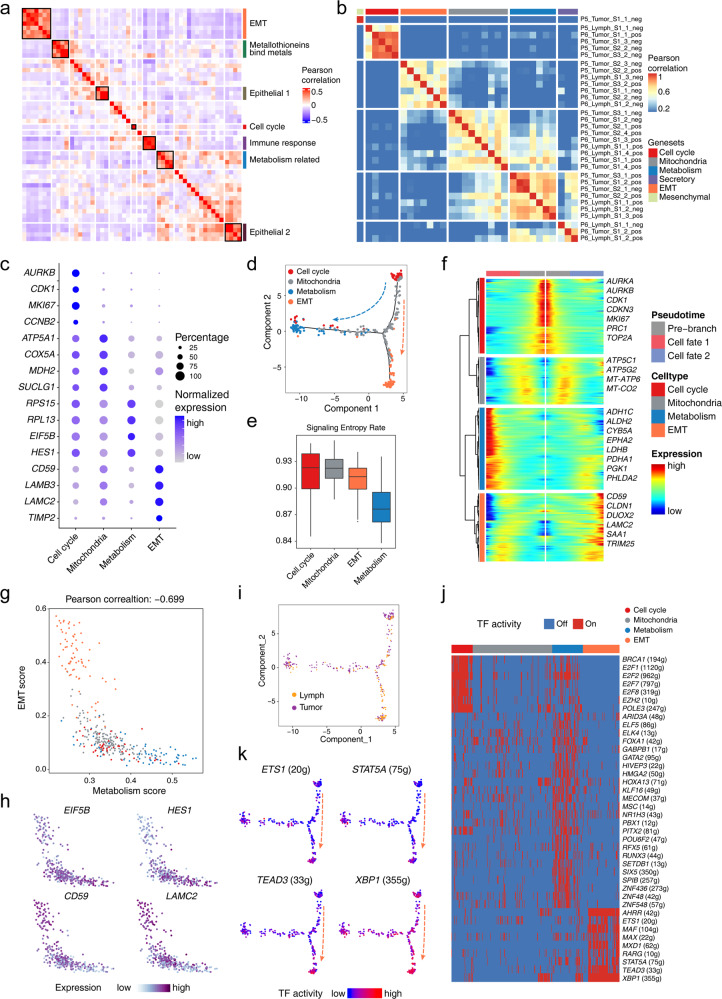
Fig. 3. Tumor heterogeneity and gene expression programs of the malignant cells.
a Heatmap showing the Pearson correlation clustering of identified intra-tumor expression programs. b Heatmap showing the Pearson correlation clustering across gene signatures extracted from the PCA output. c Dot plots presenting the normalized expression levels of corresponding markers of each gene expression program of the malignant cells in the STRT dataset. d Scatterplot showing the developmental trajectory of malignant cell identified by different expression programs using monocle2. e Boxplot showing the signaling entropy rate of cells with identified gene expression programs. f Heatmap showing diverse expression patterns of the malignant cells from different expression programs along the pseudotime trajectory. g Scatterplot exhibiting the negative correlation of metabolism- and EMT-related malignant cells. h Scatterplot exhibiting the expression levels of representative marker genes. i Scatterplot exhibiting the information of malignant cells from lymph nodes and primary tumor tissues embedded in the trajectory pathway. j Heatmap showing the on or off activities in the malignant cells of diverse expression programs. k Scatterplot showing the TF expression scores in the developmental trajectory.

