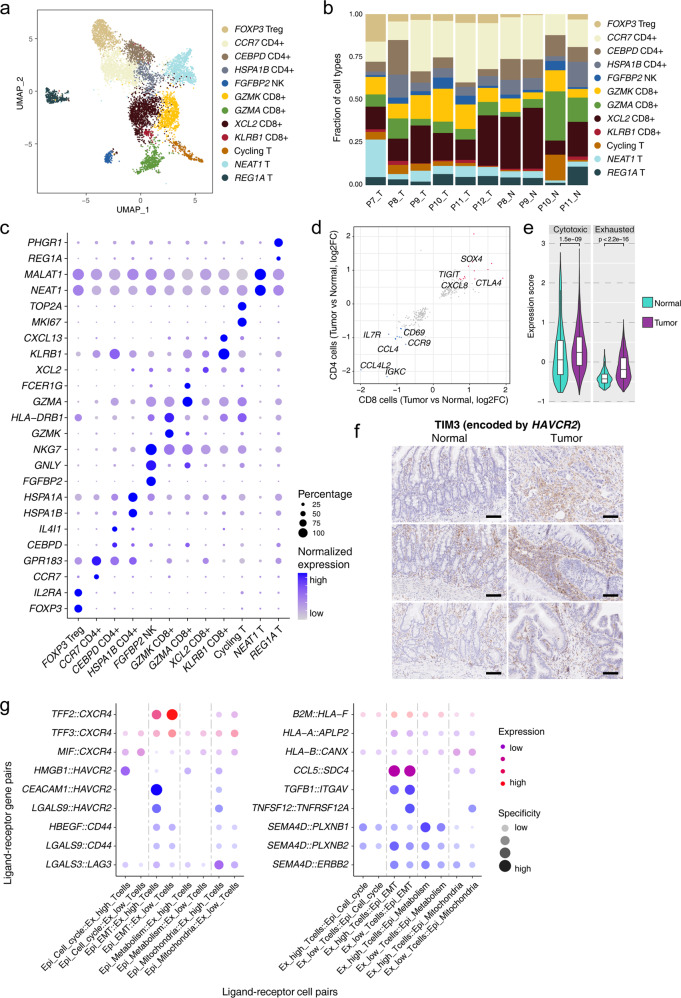
Fig. 5. CD8+ T cells with exhaustion signatures and related interactions with malignant cells.
a UMAP plot exhibiting the identified clusters of T cells in the 10× dataset. b Histogram showing cell type percentages of different T cells from collected samples in the 10× dataset. c Dot plots presenting the normalized expression levels of corresponding markers of T cell clusters in the 10× dataset. d Scatterplot showing DEGs of T cells from tumor tissues compared with normal tissues in both CD4+ and CD8+ T cells. e Violin plots showing expression of the exhaustion and cytotoxicity gene sets in CD8+ T cells from tumor and normal tissues. The P value was calculated by t-test. f Representative IHC staining of TIM3 in adjacent normal and primary tumor tissues (original magnification 100×). The rows of the paired normal and tumor samples are from the same patients, and three individual patients are listed. Scale bar, 100 μm. g Dot plot showing the expression of interaction pairs in epithelial cell and T cell pairs with different signatures.

