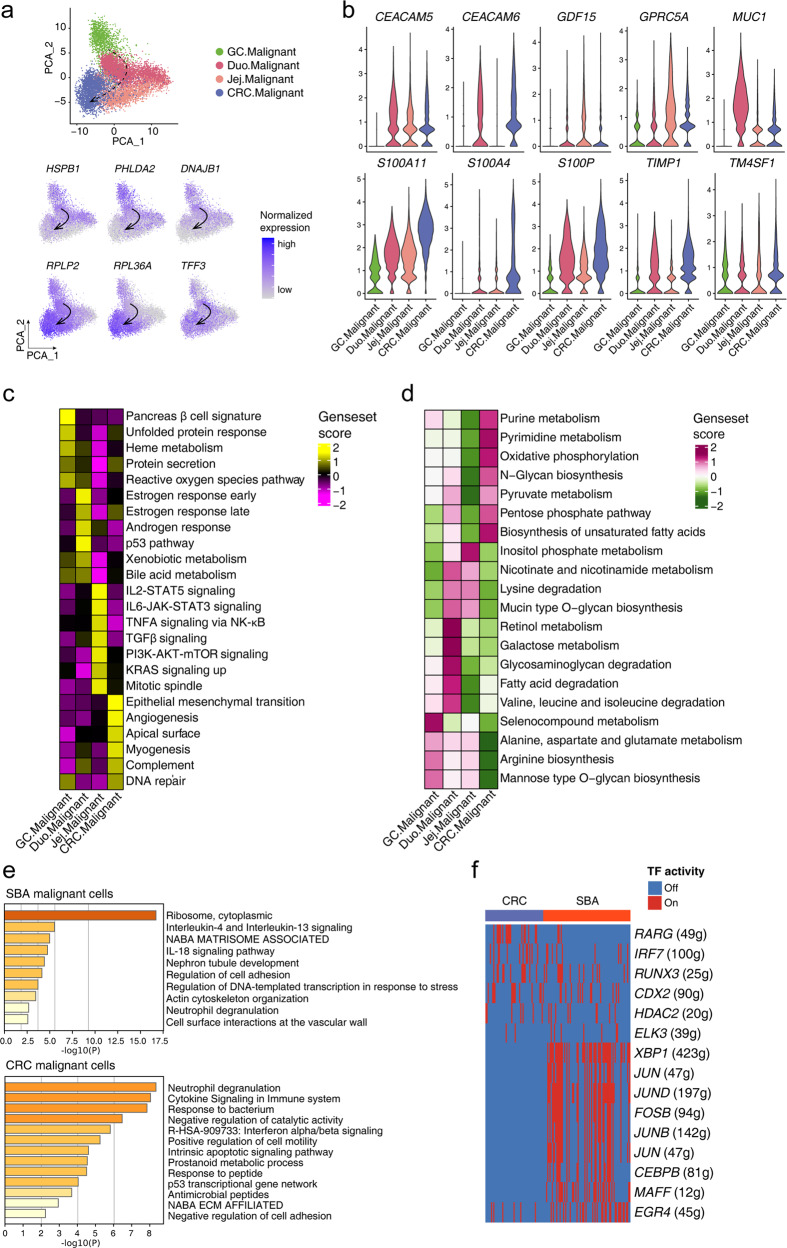
Fig. 6. Identification of the similarity and differences of SBA with other gastrointestinal cancers.
a Scatterplots exhibiting the PCA dimension reduction analysis for gastric, duodenal, jejunal to colorectal malignant cells and DEGs expressed in the PCA plot. b Violin plot exhibiting markers of SBA expressed in gastrointestinal cancers. c, d Heatmap showing gene set scores of hallmark gene sets and metabolism pathways in malignant cells from different gastrointestinal regions. e Enrichment analysis for markers of malignant cells in SBA and CRC. f Heatmap showing the TF activities of GRNs in malignant cells from SBA and CRC.

