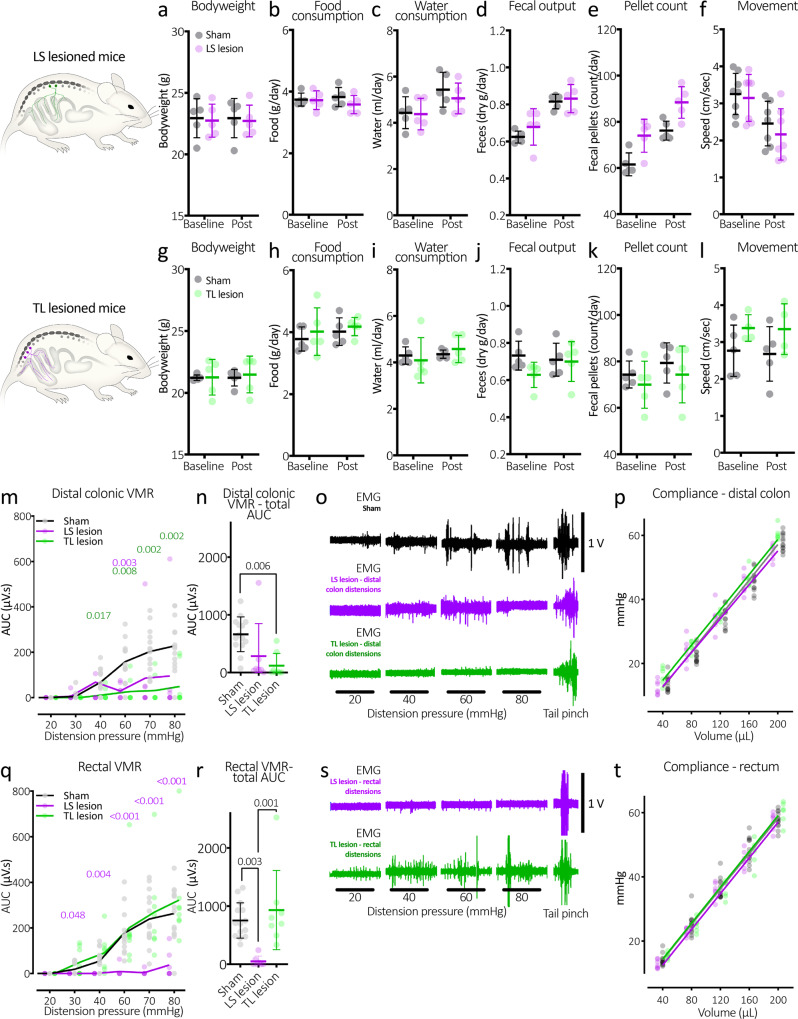
Fig. 5. Characteristics of LS and TL-lesioned mice and the abolition of the visceromotor reflex in LS lesioned mice.
a–f Bodyweight, food, water intake, faecal outputs and movement of LS lesioned mice. There were no significant changes in any parameter following the lesion surgery. g–l Characteristics of the TL-lesioned mice, also showing no significant changes following the lesion surgery. m Graph showing typical graded responses to distension of the distal colon in sham control mice (black line, grey markers). In contrast, TL-lesioned mice (green line and markers) had significantly reduced VMRs from 40 mmHg onward. P values from Tukey post-test comparisons with control values are shown in green above. LS lesioned mice also showed attenuated VMRs to distal colonic distension, showing a significant difference with control mice at 60 mmHg. n Total AUC of all distensions. TL-lesioned mice had significantly reduced AUC compared to control mice. P value refers to Tukey post-test. o Representative examples of VMRs to distal colon distensions in sham control, LS and TL-lesioned mice. Distension-evoked VMRs in control mice were similar in both rectal and distal colonic distensions. p The compliance of the distal colon was no different between the three groups of mice. q VMRs to rectal distension in LS lesion mice were largely abolished across the range of distension pressures. This suggests pain in the rectum is mediated by the lumbosacral sensory pathways. P values in purple text refer to Tukey post tests following two-way, repeated measures ANOVA: sham controls v LS lesion. r Total VMR AUC to rectal distensions was significantly lower in LS lesioned mice compared to both controls and TL-lesioned mice. P values in this figure refer to Tukey post tests. s Representative examples of VMRs to rectal distensions in LS and TL-lesioned mice. t The compliance of the rectum. This was no different between the three groups of mice. All error bars represent mean ± SD, individual markers represent individual animal averages.

