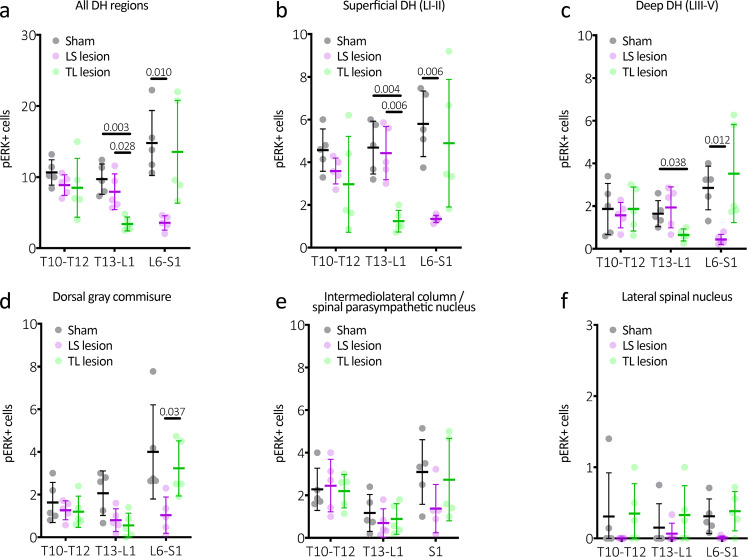
Fig. 8. Subregion analysis of distension-evoked pERK expression in the spinal cord dorsal horn.
a Average counts from all dorsal horn regions. These data are identical to that shown in Fig. 5. b Counts from the superficial dorsal horn (LI–II), which typically showed the largest numbers of pERK-IR nerve cell bodies of all subregions analysed. Here it can be seen that the LS lesioned mice have significantly lower numbers of pERK-IR cells than the other groups at the level of the lesion. Interestingly, the TL-lesioned mice showed significantly fewer pERK-IR cells at the levels of T13-L1, compared to control. This suggests some involvement of the thoracolumbar pathways to distal colonic distension, despite lacking a detectable contribution to the VMR. c Counts from the deep dorsal horn (LIII-V). This shows a similar general pattern to that seen in the superficial layers, with lower cell counts. d Counts from the dorsal grey commissure, also showing a similar pattern to superficial and deep layers. Here, only counts at L6-S1 were significantly reduced in LS lesioned mice compared to TL-lesioned mice. e Counts from the intermediolateral column or spinal parasympathetic nucleus, showing no statistically significant differences between groups. f Counts from the lateral spinal nucleus were very low and showed no significant differences between groups. P values refer to two-way, repeated measures ANOVA, Tukey post-hoc comparison tests. Individual data points represent the mean number of pERK-IR neurons per section per mouse. All error bars represent mean ± SD, individual markers represent individual animal averages.

