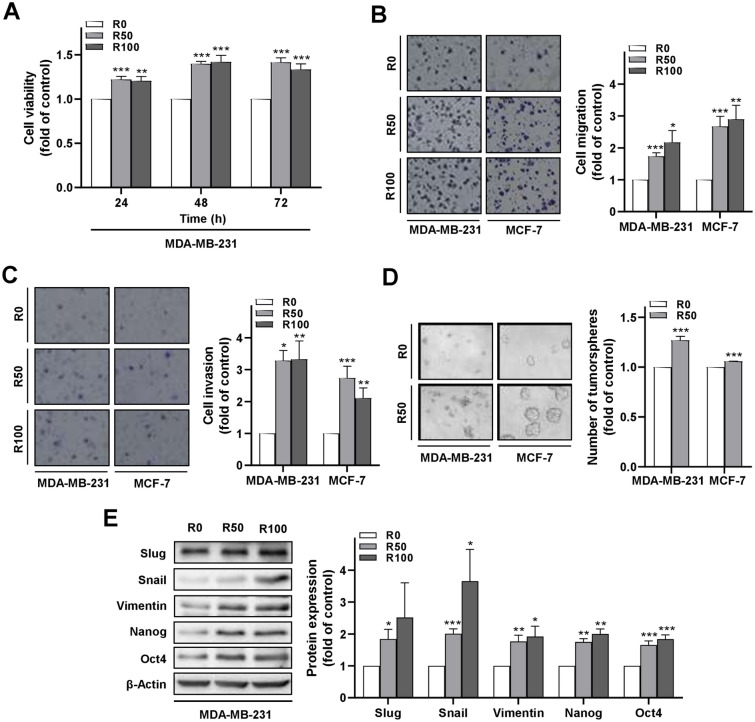
Figure 2.
Enhanced malignant behaviors of breast cancer cells after co-culture with resistin-stimulated ADSCs. The isolated ADSCs were treated with resistin at 0, 50, and 100 ng/ml (R0, R50, and R100, respectively) for 48 h, followed by co-culture with MDA-MB-231 or MCF-7 cells in the transwell model for another 72 h before the following analyses. (A) MDA-MB-231 cells after co-culture with R-ADSCs (R50 and R100) or control ADSCs (R0) were collected and re-plated in 96-well plates for cell viability assay. (B) MDA-MB-231 or MCF-7 cells after co-culture with R-ADSCs (R50 and R100) or control ADSCs (R0) were collected and re-plated in the transwell inserts for cell migration assay. (C) MDA-MB-231 or MCF-7 cells after co-culture with R-ADSCs (R50 and R100) or control ADSCs (R0) were collected and re-plated in the transwell inserts coated with Matrigel for cell invasion assay. (D) MDA-MB-231 or MCF-7 cells after co-culture with R-ADSCs (R50) or control ADSCs (R0) were collected and re-plated in ultra-low attachment microplates for tumorsphere formation assay. Quantitation was carried out for those with diameter over 50 μm. (E) MDA-MB-231 cells after co-culture with R-ADSCs (R50 and R100) or control ADSCs (R0) were collected and analyzed for protein expression of mesenchymal markers (Slug, Snail, and Vimentin) and cancer stemness markers (Nanog and Oct4) by Western blot. The original blot images were available in Supplementary Information, and these blots were cut from full-length membranes prior to hybridization with the corresponding antibodies. Data were obtained from three independent experiments and presented as mean ± SEM. Statistical difference was determined by t-test comparing R50 or R100 group versus their corresponding R0 group as control. *p < 0.05; **p < 0.01; ***p < 0.001.

