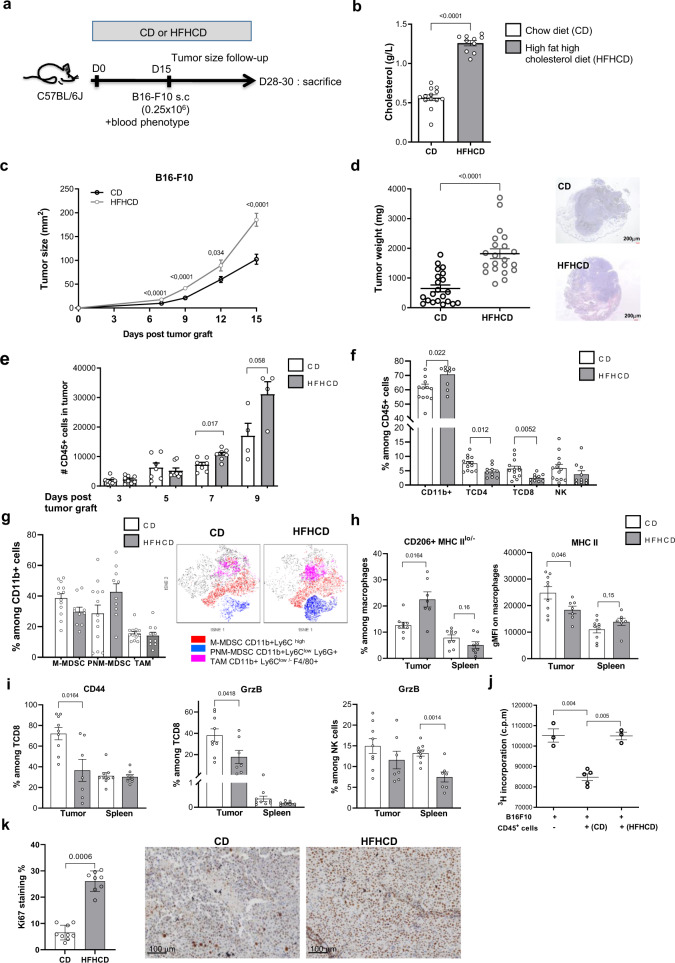
Fig. 2. Pro-atherogenic HFHCD accelerates B16-F10 melanoma growth in C57BL/6J mice.
a Experimental design. b Total blood cholesterol (n = 13 in CD group, n = 10 in HFHCD group, pool of two independent experiments). c Tumor growth evolution at day 7 (n = 23 in CD group, n = 17 in HFHCD group), day 9 (n = 35 in CD group, n = 24 in HFHCD group), day 12 (n = 22 in CD group, n = 13 in HFHCD group) and day 15 (n = 26 in CD group, n = 19 in HFHCD group). Data were pooled from five experiments. d tumor weight at the time of sacrifice (n = 21 mice/group, pool of five independent experiments). Representative microphotographies of tumor sections after hematoxilin/eosin coloration. e Quantification of CD45+ leukocytes in the tumor, by flow cytometry (n = 8 mice/group for evaluation at day 3, 5, 7 and n = 8/group at day 9. Data were pooled from three experiments). Flow cytometry analysis of f main subsets of leukocytes (%) in tumors at the time of sacrifice (n = 13 in CD group and n = 10 in HFHCD group), g and of M-MDSC (CD11b+ Ly6Chi), PNM-MDSC (CD11b+ Ly6Clo Ly6G+) and TAM (CD11b+Ly6Clo Ly6G- F4/80+) among CD11b+ cells in the tumor (n = 13 in CD group and n = 10 in HFHCD group, pool of two independent experiments) (left), and t-SNE plots representing an overlay of total CD45+ cells (gray) and M-MDSC (red), PNM-MDSC (blue) and TAM (purple) (right). h gMFI of MHC II and (%) CD206+MHC IIlo in macrophages (M2 markers) in tumor and spleen (n = 9 in CD group and n = 7 in HFHCD group, unpaired t-test). i Expression of CD44 (%) and granzyme B (%) among CD8+ and NK cells in the tumor and spleen (n = 9 in CD group and n = 7 in HFHCD group). j B16-F10 proliferation was measured by 3H-Thymidine incorporation. B16-F10 were cultured, for 24 h, alone (n = 3) or with CD45+ cells isolated from CD (n = 5) or HFHCD tumors (n = 3). k Ki-67 immunohistochemistry staining was performed on FFPE tumor. (left) Quantification of % DAB staining and (right) representative picture of Ki-67 staining in the CD group (n = 9) and in the HFHCD group (n = 8). Scale bar = 100 µm. Data are expressed as mean ± s.e.m. Analysis of difference within groups were performed with Mann–Whitney t-test, and with one-way ANOVA with Bonferroni’s multiple adjustment test. Source data are provided as a Source Data file.

